


Narendra Modi’s candidacy for prime minister largely rests on claims of turning around his state of Gujarat. With national elections underway, a Gallup poll finds that more than one-third of Indians feel their economy is getting worse.
If elected, can Modi turn that perception around too?
Quartz has examined Gujarat entirely through the lens of available public data, much of which is graphed below. While governance is a chief platform of the Modi campaign, and the state he oversaw is held up as a shining example of how India can and should grow, Gujarat’s overall numbers actually show a mixed picture.
Since Modi took over in October of 2001, Gujarat’s economy has vastly improved by some measures and continued to do as well as it did before he took office by others. But in non-fiscal indicators such as health and overall quality of life, Gujarat has sometimes slipped under Modi. In a few measures, Gujarat has done worse than before Modi took control.
(A note: Unless otherwise indicated, years below refer to the Indian fiscal year that starts on April 1. So 2000, for example, actually refers to the 2000-2001 Indian fiscal year.)
The Economy
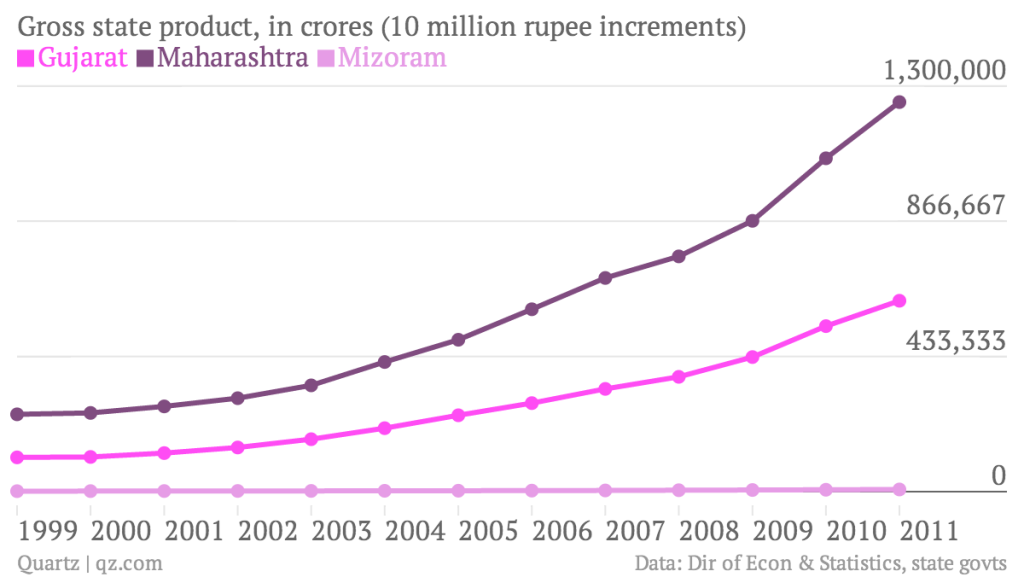
To get a sense of how Gujarat’s economy was growing compared to other states, let’s look first at gross state product. Absolute GSP varies from state to state dramatically, because of overall size, population and historical levels of industry. Gujarat has long been mid-pack. Here, as in many instances below, we’ve charted Gujarat’s statistics since before Modi took office and compared it to the progress of the best state or union territory and the worst over time.
Overall, Gujarat’s GSP product has grown at an average of 16.6% a year from 2001 to 2010, up from an annual average of 5.1% from 1980 to 1990 and 8.2% from 1991 to 1998, according to the Planning Commission (pdf, p 2). In the 1991 to 1998 period (before Modi took office) Gujarat was the fastest-growing of India’s 14 major states based on GSP. From 2001 to 2010, Gujarat’s annual average state domestic product growth is bested by Uttarakhand (18%), a state created in 2000, and Sikkim (19.2%) which was not counted as a “major state” in the 1991 to 1998 figures.
Gujarat’s All-India ranking, based on overall GSP: 2011/12: 5th; 1999/2000: 6th
GSP per capita
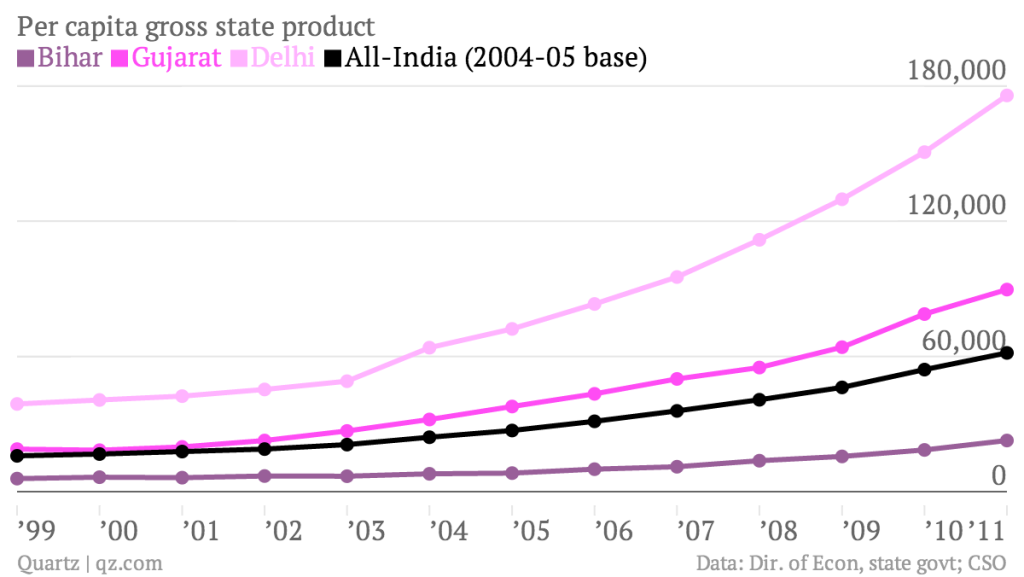
By another measure, GSP per capita, all of India has again grown significantly in recent years. Here, Gujarat’s domestic product has grown faster than the overall average but again remains far from the lead, behind Goa, Maharashtra, Tamil Nadu and others. We’ve graphed Gujarat’s per capita GSP versus India’s highest and lowest states or union territory below and the all-India average, based on current prices, in rupees.
Gujarat’s all-India ranking, based on per capita GSP: 2011-12: 8th, up from 12th in the 2000-2001 fiscal year.
Unemployment rates
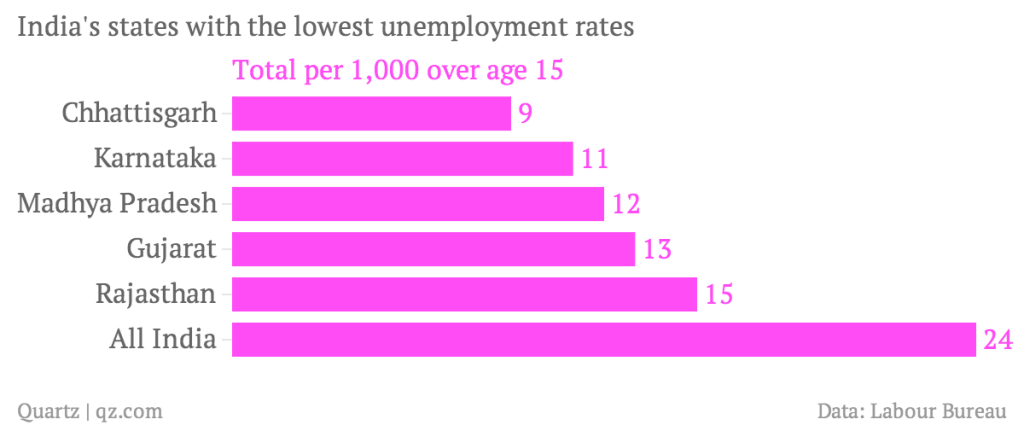
Gujarat’s unemployment rate is low, a position the state has held since the 1990s, according to the latest unemployment survey for the 2012-2013 fiscal year (pdf, g 84), but behind several other fast-growth states:
Gujarat’s All-India ranking for unemployment, where 1 is the lowest: 2012, 4th based on data from the Labor Bureau, which only dates back to 2009. Based on “National Sample Survey data,” Gujarat’s rural unemployment ranking in 2011 was 2nd, tied with Madhya Pradesh, verus 5th in 1999. Ranked on urban unemployment, Gujarat was 1st in 2011 and 1st in 1999.
Foreign direct investment
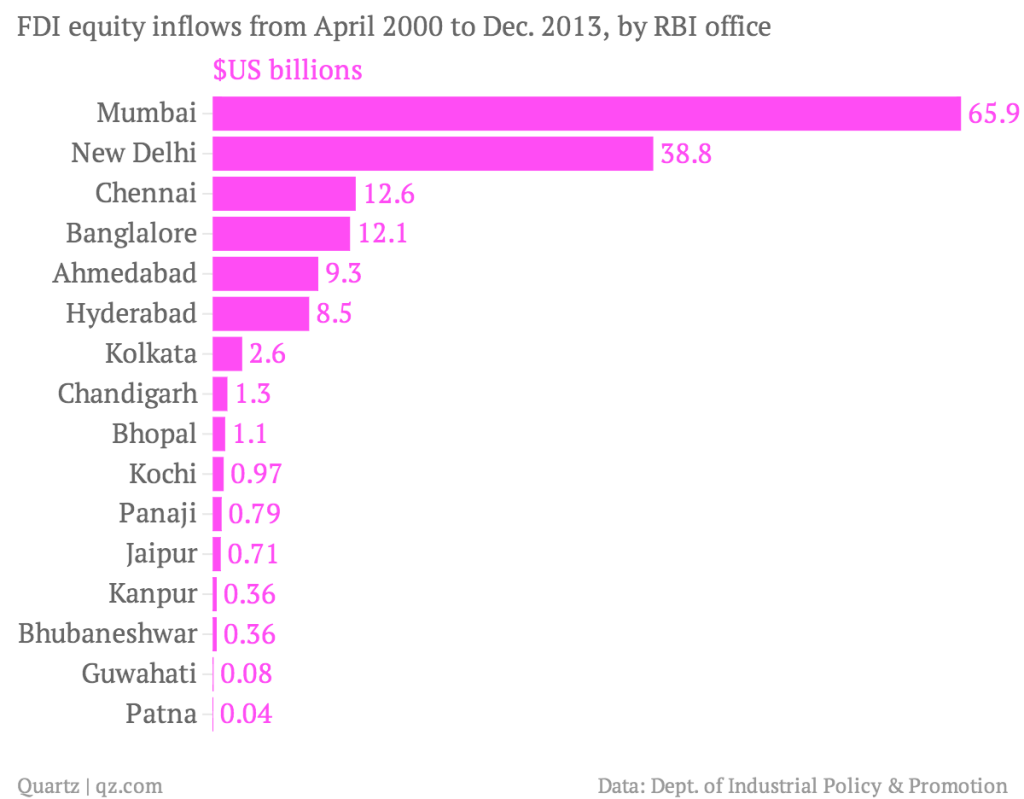
In his tenure as chief minister of Gujarat, this has been one of Modi’s top priorities, a push that’s been accompanied by high-profile investment summits and the construction of new factories by Bombardier and other foreign manufacturers. Gujarat, Modi likes to say, has become the “global Gateway to India”.
On FDI inflows, though, Gujarat remains dwarfed by other states that have been the traditional “gateway” to the country, according to a Reserve Bank of India report that dates from the year before he took office. The RBI ranked its own offices in the cities that made the reports, not the states they are in, so “Mumbai” here can be considered a proxy for Maharashtra, Chennai for Tamil Nadu and Ahmedabad for Gujarat.
In recent years, drawing FDI to Gujarat has had mixed results, according to the most recent data available. (Years below refer to the Indian fiscal year).
Gujarat’s all-India ranking, based on FDI: 5th, from April 2000 to Dec. 2013.
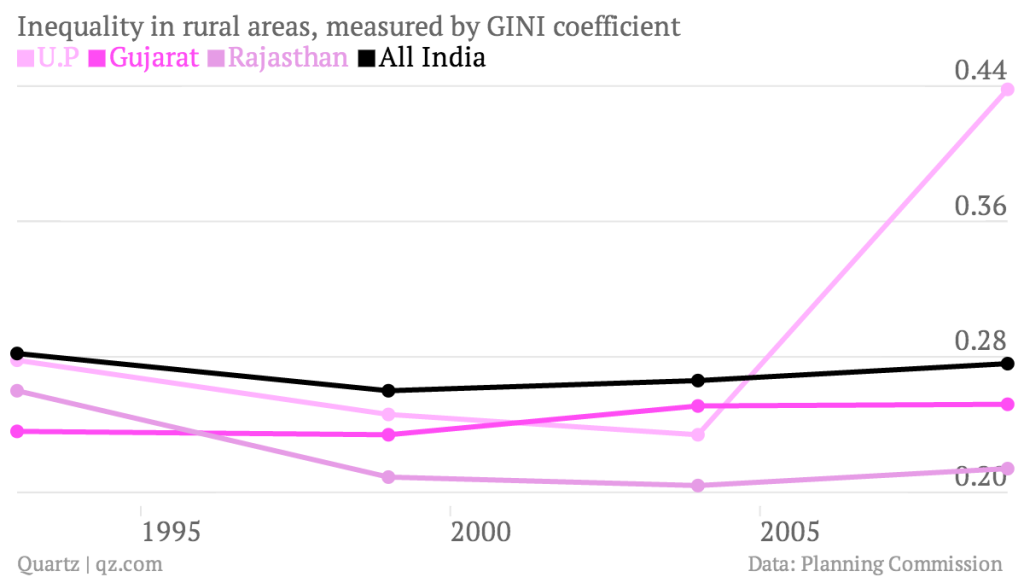
Income equality, rural & urban
Inequality in India’s rural areas is on the rise in the past decade, after dropping through most of the 1990s, when judged by the Gini coefficient, a measure of inequality in which a score of “zero” means perfect equality and “one” means one person owns everything. Gujarat saw a sharper rise than the rest of India from 1999 through 2004, and then improvement, and remains mid-pack here. Uttar Pradesh has by far the worst income inequality in rural India, while Rajasthan’s rural inequality levels fell sharply after 1991 and remain below that level.
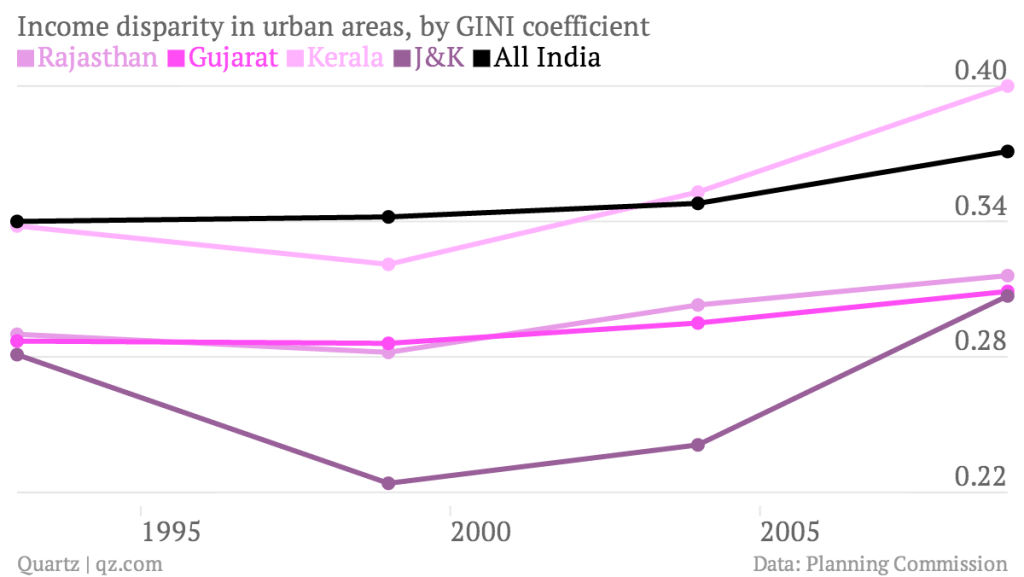
On a urban basis, Gujarat’s income inequality is growing as well, but less sharply than some other fast-growth states.
On an all-India basis, Gujarat ranked 15th based on urban inequality, where 1 represents the highest inequality in the 2009-2010 fiscal year, the latest available. On the basis of rural inequality, Gujarat was 20th. Complete GINI coefficient data for all Indian states is not available for the 1999-2000 period so comparing Gujarat’s inequality versus other states during that time period to the present is not meaningful.
Quality of Life
The Human Development Index
The HDI is calculated based on life expectancy, income, and education and is used by the United Nations to judge quality of life (and was co-created by Nobel Prize-winning economist Amartya Sen in 1990).
Gujarat’s human development index figure has grown faster than the all India figure in recent years, but far slower than several of the fastest growth states, like Kerala. Based on HDI, Gujarat has dropped sharply in the all-India rankings since Modi took office.
Gujarat’s all-India ranking, based on HDI – 2007-2008 (latest available): 11th, down from 6th in 2001 and 6th in 1991.
Water
Gujarati’s access to safe drinking water has increased dramatically since 1981, as it has for most of India. The increase has slowed since Modi took office, from 25% between 1991 and 2001, to 7% in the subsequent decade, a slowdown echoed by the rest of the country – probably because the hardest-to-reach places will be the last anywhere to get water.
Gujarat is mid-pack compared to the rest of India on the basis of safe drinking water accessibility, lagging behind 14 states and territories, including Delhi, Haryana, Punjab and Uttar Pradesh.
Gujarat’s overall ranking, on the basis of safe drinking water accessibility has dropped from 14th in the 2001 census to 15th in 2011. On the availability of tap water, Gujarat’s rural households rank 15th and urban 9th, according to the 2011 Census.
Gujarat’s more pressing water woes come from a scarcity of water, with 10 districts out of 33 and some 4,000 villages affected by drought last year, according to state officials, despite a decade of normal monsoons.(The central government said 17 districts were affected.)
Long-planned projects such as the Sardar Sarovar Dam on the Narmada River and the Kalpasar dam project are running years behind schedule. The Kalpasar project, which was first floated in 1998, is likely to commence its construction work this year, according to the state government.
Women and children
The overall ratio of women to men in Gujarat – a measure of both how widespread female infanticide is, and attention paid to girls’ and women’s health – has been in constant decline for decades. In 1981, there were 942 females born per thousand males, but the 2011 census shows that number has slipped to 918.
Over the same time, the overall India ratio has improved, and some states and territories, including Mizoram, have improved remarkably. Even Chandigarh, the territory, which had the most unbalanced sex ratio in 1981, has seen improvement in that time.
Gujarat’s All-India ranking, based on sex ratio: 2011: 24th, down from 17th in 1991.
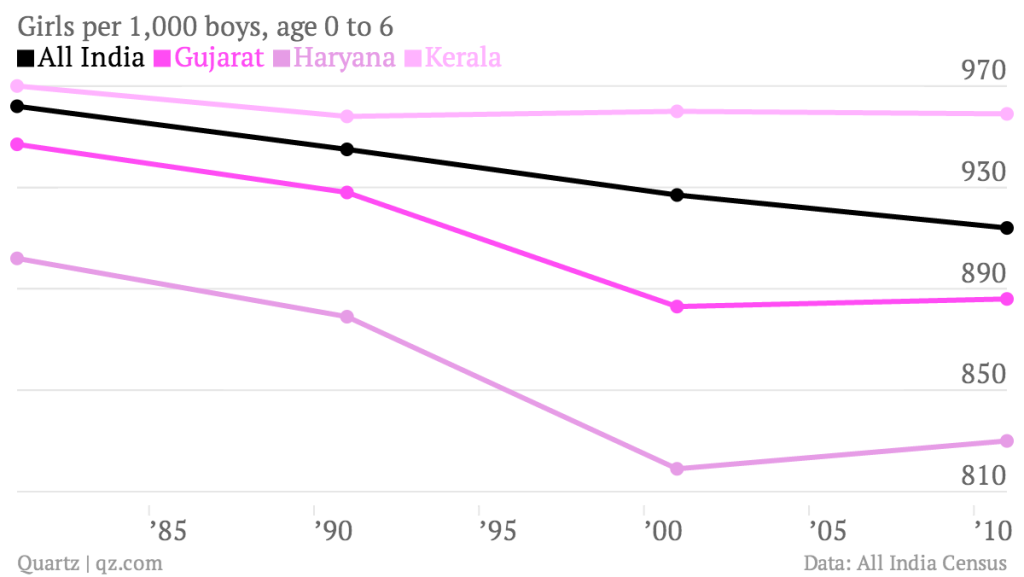
Child Sex Ratio
Gujarat’s child sex ratio, a comparison of female to male children age six and under, is currently far below India’s average, and has improved slightly since Modi took office. The ratio dropped from 928 to 883 between 1991 and 2001, but improved after the Gujarat government launched a ‘Save the Girl Child’ campaign in 2005 with the help of Unicef. Authorities confiscated ultrasound machines, sent thousands of counselors across Gujarat and a large community of landholders vowed to fight against female foeticide. Still it remains well below the All India ratio.
Gujarat’s all-India ranking, based on child sex ratio: 2011: 27th, versus 28th in 1991
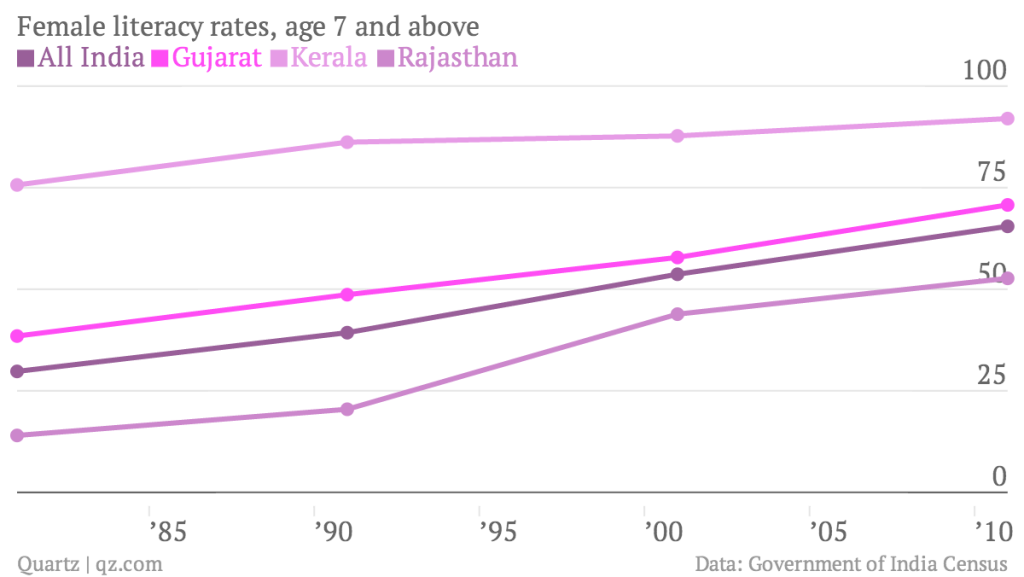
Female literacy rates
Gujarat scores better here, outperforming the India average . The state’s female literacy rate has been better than the India average since well before Modi took office, and its rate of improvement has remained virtually the same for the past two decades.
Gujarat’s all-India ranking, based on female literacy rates: 20th in 2011 vs. 21st in 2001, based on Planning Commission data.
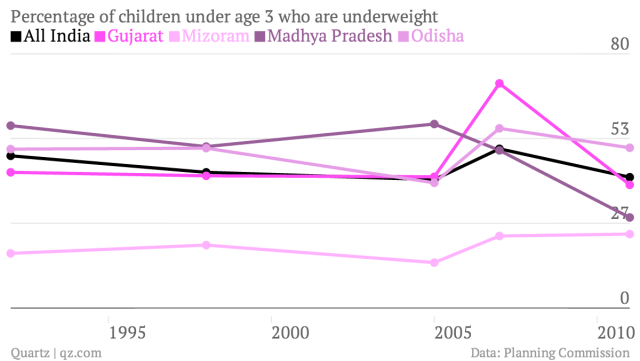
Child malnutrition
The percentage of Gujarat’s children under the age of three who were officially classified as “underweight” skyrocketed early in Modi’s term, to over 70% – by far the highest of any state in the nation. Years after taking office, he was “shocked” when informed the state was not performing as well as the rest of India, The Times of India reported in 2007, and started a programme to distribute vitamin-enriched chocolates to undernourished kids.
In a 2012 interview with the the Wall Street Journal, when asked what he was doing to combat malnutrition, Modi blamed the problem on “beauty conscious” middle class girls who refused to drink milk because they thought it would make them fat. Malnutrition in young children has fallen sharply since 2007, to just below the Indian average, the most-improved state between 2007 and 2011.
Gujarat’s all-India child malnutrition ranking, where the highest rank has the least number of malnourished children: 2011 21st, versus 20th in 1998.
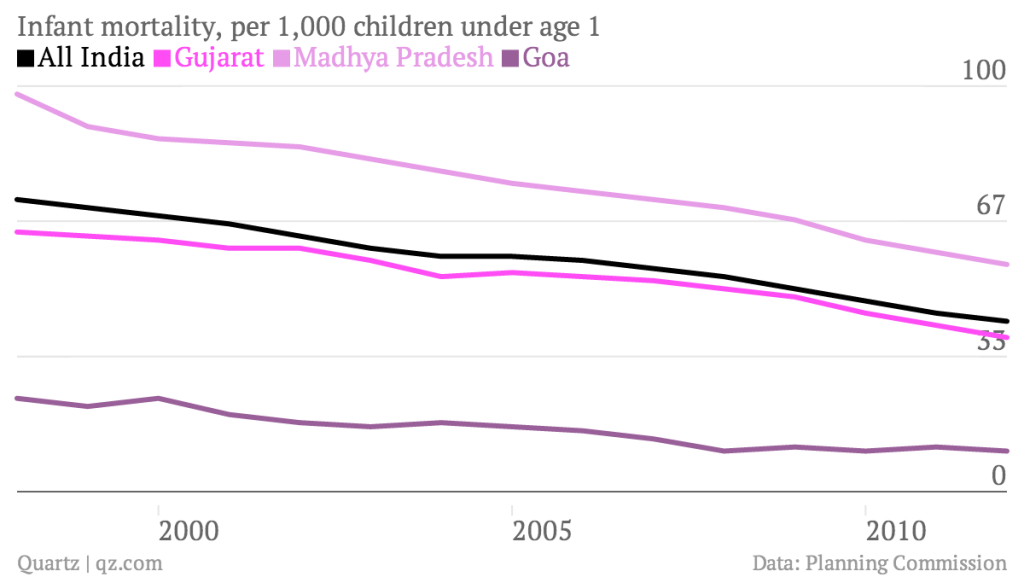
Infant mortality
Gujarat’s infant mortality rates have been dropping since the 1990s, as they have in the rest of India, but the state remains near the very bottom of India’s rankings. Infant mortality in Gujarat has fallen to 38 per 1,000 in 2012 from 57 in 2003- a drop of 33.3% – more than the 30% decline nationally.
In 2005-06, the Gujarat government launched a public-private partnership called the Chiranjeevi Yojana scheme to reduce the maternal and infant mortality rate in rural areas by encouraging mothers to deliver in private hospitals. It provides free childbirth care at designated private hospitals for women below the poverty line.
Still, according to 2012 figures, Gujarat ranks 23rd among the 28 Indian states, when ranked by the least number of infant deaths per thousand live births. (The top-ranked have the least deaths).
In terms of the under-five mortality rate, or child mortality rate, six districts in Gujarat are among the 42 worst-performing districts in India, according to a report published by the international health journal, Lancet. Gujarat is the worst performer among the 11 states classified as rich, it says.
This post originally appeared on Qz.com.
We welcome your comments at
letters@scroll.in.
If elected, can Modi turn that perception around too?
Quartz has examined Gujarat entirely through the lens of available public data, much of which is graphed below. While governance is a chief platform of the Modi campaign, and the state he oversaw is held up as a shining example of how India can and should grow, Gujarat’s overall numbers actually show a mixed picture.
Since Modi took over in October of 2001, Gujarat’s economy has vastly improved by some measures and continued to do as well as it did before he took office by others. But in non-fiscal indicators such as health and overall quality of life, Gujarat has sometimes slipped under Modi. In a few measures, Gujarat has done worse than before Modi took control.
(A note: Unless otherwise indicated, years below refer to the Indian fiscal year that starts on April 1. So 2000, for example, actually refers to the 2000-2001 Indian fiscal year.)
The Economy
To get a sense of how Gujarat’s economy was growing compared to other states, let’s look first at gross state product. Absolute GSP varies from state to state dramatically, because of overall size, population and historical levels of industry. Gujarat has long been mid-pack. Here, as in many instances below, we’ve charted Gujarat’s statistics since before Modi took office and compared it to the progress of the best state or union territory and the worst over time.
Overall, Gujarat’s GSP product has grown at an average of 16.6% a year from 2001 to 2010, up from an annual average of 5.1% from 1980 to 1990 and 8.2% from 1991 to 1998, according to the Planning Commission (pdf, p 2). In the 1991 to 1998 period (before Modi took office) Gujarat was the fastest-growing of India’s 14 major states based on GSP. From 2001 to 2010, Gujarat’s annual average state domestic product growth is bested by Uttarakhand (18%), a state created in 2000, and Sikkim (19.2%) which was not counted as a “major state” in the 1991 to 1998 figures.
Gujarat’s All-India ranking, based on overall GSP: 2011/12: 5th; 1999/2000: 6th
GSP per capita
By another measure, GSP per capita, all of India has again grown significantly in recent years. Here, Gujarat’s domestic product has grown faster than the overall average but again remains far from the lead, behind Goa, Maharashtra, Tamil Nadu and others. We’ve graphed Gujarat’s per capita GSP versus India’s highest and lowest states or union territory below and the all-India average, based on current prices, in rupees.
Gujarat’s all-India ranking, based on per capita GSP: 2011-12: 8th, up from 12th in the 2000-2001 fiscal year.
Unemployment rates
Gujarat’s unemployment rate is low, a position the state has held since the 1990s, according to the latest unemployment survey for the 2012-2013 fiscal year (pdf, g 84), but behind several other fast-growth states:
Gujarat’s All-India ranking for unemployment, where 1 is the lowest: 2012, 4th based on data from the Labor Bureau, which only dates back to 2009. Based on “National Sample Survey data,” Gujarat’s rural unemployment ranking in 2011 was 2nd, tied with Madhya Pradesh, verus 5th in 1999. Ranked on urban unemployment, Gujarat was 1st in 2011 and 1st in 1999.
Foreign direct investment
In his tenure as chief minister of Gujarat, this has been one of Modi’s top priorities, a push that’s been accompanied by high-profile investment summits and the construction of new factories by Bombardier and other foreign manufacturers. Gujarat, Modi likes to say, has become the “global Gateway to India”.
On FDI inflows, though, Gujarat remains dwarfed by other states that have been the traditional “gateway” to the country, according to a Reserve Bank of India report that dates from the year before he took office. The RBI ranked its own offices in the cities that made the reports, not the states they are in, so “Mumbai” here can be considered a proxy for Maharashtra, Chennai for Tamil Nadu and Ahmedabad for Gujarat.
In recent years, drawing FDI to Gujarat has had mixed results, according to the most recent data available. (Years below refer to the Indian fiscal year).

Gujarat’s all-India ranking, based on FDI: 5th, from April 2000 to Dec. 2013.
Income equality, rural & urban
Inequality in India’s rural areas is on the rise in the past decade, after dropping through most of the 1990s, when judged by the Gini coefficient, a measure of inequality in which a score of “zero” means perfect equality and “one” means one person owns everything. Gujarat saw a sharper rise than the rest of India from 1999 through 2004, and then improvement, and remains mid-pack here. Uttar Pradesh has by far the worst income inequality in rural India, while Rajasthan’s rural inequality levels fell sharply after 1991 and remain below that level.
On a urban basis, Gujarat’s income inequality is growing as well, but less sharply than some other fast-growth states.
On an all-India basis, Gujarat ranked 15th based on urban inequality, where 1 represents the highest inequality in the 2009-2010 fiscal year, the latest available. On the basis of rural inequality, Gujarat was 20th. Complete GINI coefficient data for all Indian states is not available for the 1999-2000 period so comparing Gujarat’s inequality versus other states during that time period to the present is not meaningful.
Quality of Life
The Human Development Index
The HDI is calculated based on life expectancy, income, and education and is used by the United Nations to judge quality of life (and was co-created by Nobel Prize-winning economist Amartya Sen in 1990).
Gujarat’s human development index figure has grown faster than the all India figure in recent years, but far slower than several of the fastest growth states, like Kerala. Based on HDI, Gujarat has dropped sharply in the all-India rankings since Modi took office.
Gujarat’s all-India ranking, based on HDI – 2007-2008 (latest available): 11th, down from 6th in 2001 and 6th in 1991.

Water
Gujarati’s access to safe drinking water has increased dramatically since 1981, as it has for most of India. The increase has slowed since Modi took office, from 25% between 1991 and 2001, to 7% in the subsequent decade, a slowdown echoed by the rest of the country – probably because the hardest-to-reach places will be the last anywhere to get water.
Gujarat is mid-pack compared to the rest of India on the basis of safe drinking water accessibility, lagging behind 14 states and territories, including Delhi, Haryana, Punjab and Uttar Pradesh.
Gujarat’s overall ranking, on the basis of safe drinking water accessibility has dropped from 14th in the 2001 census to 15th in 2011. On the availability of tap water, Gujarat’s rural households rank 15th and urban 9th, according to the 2011 Census.
Gujarat’s more pressing water woes come from a scarcity of water, with 10 districts out of 33 and some 4,000 villages affected by drought last year, according to state officials, despite a decade of normal monsoons.(The central government said 17 districts were affected.)
Long-planned projects such as the Sardar Sarovar Dam on the Narmada River and the Kalpasar dam project are running years behind schedule. The Kalpasar project, which was first floated in 1998, is likely to commence its construction work this year, according to the state government.
Women and children
The overall ratio of women to men in Gujarat – a measure of both how widespread female infanticide is, and attention paid to girls’ and women’s health – has been in constant decline for decades. In 1981, there were 942 females born per thousand males, but the 2011 census shows that number has slipped to 918.
Over the same time, the overall India ratio has improved, and some states and territories, including Mizoram, have improved remarkably. Even Chandigarh, the territory, which had the most unbalanced sex ratio in 1981, has seen improvement in that time.

Gujarat’s All-India ranking, based on sex ratio: 2011: 24th, down from 17th in 1991.
Child Sex Ratio
Gujarat’s child sex ratio, a comparison of female to male children age six and under, is currently far below India’s average, and has improved slightly since Modi took office. The ratio dropped from 928 to 883 between 1991 and 2001, but improved after the Gujarat government launched a ‘Save the Girl Child’ campaign in 2005 with the help of Unicef. Authorities confiscated ultrasound machines, sent thousands of counselors across Gujarat and a large community of landholders vowed to fight against female foeticide. Still it remains well below the All India ratio.
Gujarat’s all-India ranking, based on child sex ratio: 2011: 27th, versus 28th in 1991
Female literacy rates
Gujarat scores better here, outperforming the India average . The state’s female literacy rate has been better than the India average since well before Modi took office, and its rate of improvement has remained virtually the same for the past two decades.
Gujarat’s all-India ranking, based on female literacy rates: 20th in 2011 vs. 21st in 2001, based on Planning Commission data.
Child malnutrition
The percentage of Gujarat’s children under the age of three who were officially classified as “underweight” skyrocketed early in Modi’s term, to over 70% – by far the highest of any state in the nation. Years after taking office, he was “shocked” when informed the state was not performing as well as the rest of India, The Times of India reported in 2007, and started a programme to distribute vitamin-enriched chocolates to undernourished kids.
In a 2012 interview with the the Wall Street Journal, when asked what he was doing to combat malnutrition, Modi blamed the problem on “beauty conscious” middle class girls who refused to drink milk because they thought it would make them fat. Malnutrition in young children has fallen sharply since 2007, to just below the Indian average, the most-improved state between 2007 and 2011.
Gujarat’s all-India child malnutrition ranking, where the highest rank has the least number of malnourished children: 2011 21st, versus 20th in 1998.
Infant mortality
Gujarat’s infant mortality rates have been dropping since the 1990s, as they have in the rest of India, but the state remains near the very bottom of India’s rankings. Infant mortality in Gujarat has fallen to 38 per 1,000 in 2012 from 57 in 2003- a drop of 33.3% – more than the 30% decline nationally.
In 2005-06, the Gujarat government launched a public-private partnership called the Chiranjeevi Yojana scheme to reduce the maternal and infant mortality rate in rural areas by encouraging mothers to deliver in private hospitals. It provides free childbirth care at designated private hospitals for women below the poverty line.
Still, according to 2012 figures, Gujarat ranks 23rd among the 28 Indian states, when ranked by the least number of infant deaths per thousand live births. (The top-ranked have the least deaths).
In terms of the under-five mortality rate, or child mortality rate, six districts in Gujarat are among the 42 worst-performing districts in India, according to a report published by the international health journal, Lancet. Gujarat is the worst performer among the 11 states classified as rich, it says.
This post originally appeared on Qz.com.