Just over a year ago, one of the most destructive rock-ice avalanches in Uttarakhand hit a small township, tragically wiping out more than 200 lives, several bridges, roads and two hydroelectric power plants.
Known as the Chamoli disaster, it was unique in its magnitude. Despite consisting of 80% of rock and only 20% of ice, the avalanche mass was able to travel around 13-km downstream before it turned into a debris flow, causing a flash flood in the Rishiganga and Dhauliganga rivers.
The scale of the disaster attracted the attention of scientists around the world. In the past several months, more than ten research articles have been published covering investigations into possible causes and changes to the valley afterwards.
Remote sensing
Given the lack of field measurements due to the remote extreme terrain of this region, all these published studies have extensively used earth observation data from remote sensing satellites. Special cameras on earth observation satellites capture the energy that is either emitted or reflected from the Earth’s surface or its atmosphere, so remote sensing helps monitor particular environments quickly and effectively.
Space agencies such as NASA and the European Space Agency and companies such as Planet Labs are providing free, medium-to-high resolution images of Earth, encouraging independent research and scientific investigations. In fact, Planet Lab’s PlanetScope satellites were able to capture the Chamoli disaster in real-time.
The increasing number and capabilities of these satellites are proving to be extremely useful in understanding high-mountain hazards. Online geo-visualisation platforms such as Google Earth are offering repeat high-resolution images, enabling quick and effective visual analysis. In our study, we were able to simulate and reconstruct the Chamoli disaster and a previous ice avalanche at the same site thanks to the rich archive of remote sensing data.
Avalanche hot spot
Our research started with an interesting observation, also reported by other studies: the Chamoli disaster site is a hotspot for avalanches. Scanning through past satellite images from the last 20 years, we identified two ice avalanches and several snow avalanches in the same valley.

Ice avalanches caused by the breakage of a hanging glacier in early 2000 and again in September 2016 were massive, consisting of approximately 10 million m³ of glacial ice, filling around 3.5 km of the valley floor with debris deposits that reached heights of up to 50 metres. However, because the Chamoli disaster occurred within 4.5 years of the September 2016 ice avalanche, it makes the whole scenario even more intriguing.
The 2021 disaster was caused by an avalanche which, although more than 2.5 times more voluminous than the 2016 event, was made of 80% of rocks contrary to the pure icy composition of 2016’s avalanche.
The sequence of these two massive and constituently different ice avalanches, originating from the same elevation and hitting the same valley within a period of five years, is unique. It offered us an unprecedented natural testbed to understand how frequent avalanches, with varying degree of ice content, can vary in terms of their run-out and destructive power.

Predicting the future
Adopting an integrative approach, we studied both the pre-event and during-event flow characteristics of the 2016 and 2021 avalanches. We observed short-term and long-term changes in the rate of surface movement which reaches up to over around five times the normal values.
The estimation of surface movements has proven effective in observing the development and trajectory of ice avalanches in the past. In 1973, movements were measured for the first time on an unstable hanging glacier in order to predict its collapse.
The success of this field-based monitoring approach was demonstrated in 2014 by the accurate prediction of a hanging glacier “break-off” from the south face of the Grandes Jorasses in Italy, 10 days before the avalanche happened.
But logistics issues in these high-mountain areas mean these kinds of field-based efforts are limited. Our observations, particularly for the 2016 avalanche, highlight that remote sensing movement estimations not only have larger coverage, but can also represent a timely, cost-effective and safer way to monitor hanging glaciers, and possibly even predict large and dangerous ice avalanches.
But there are uncertainties associated with remote sensing observations, and any possible future predictability certainly requires more research to identify statistically significant trends in surface movements.
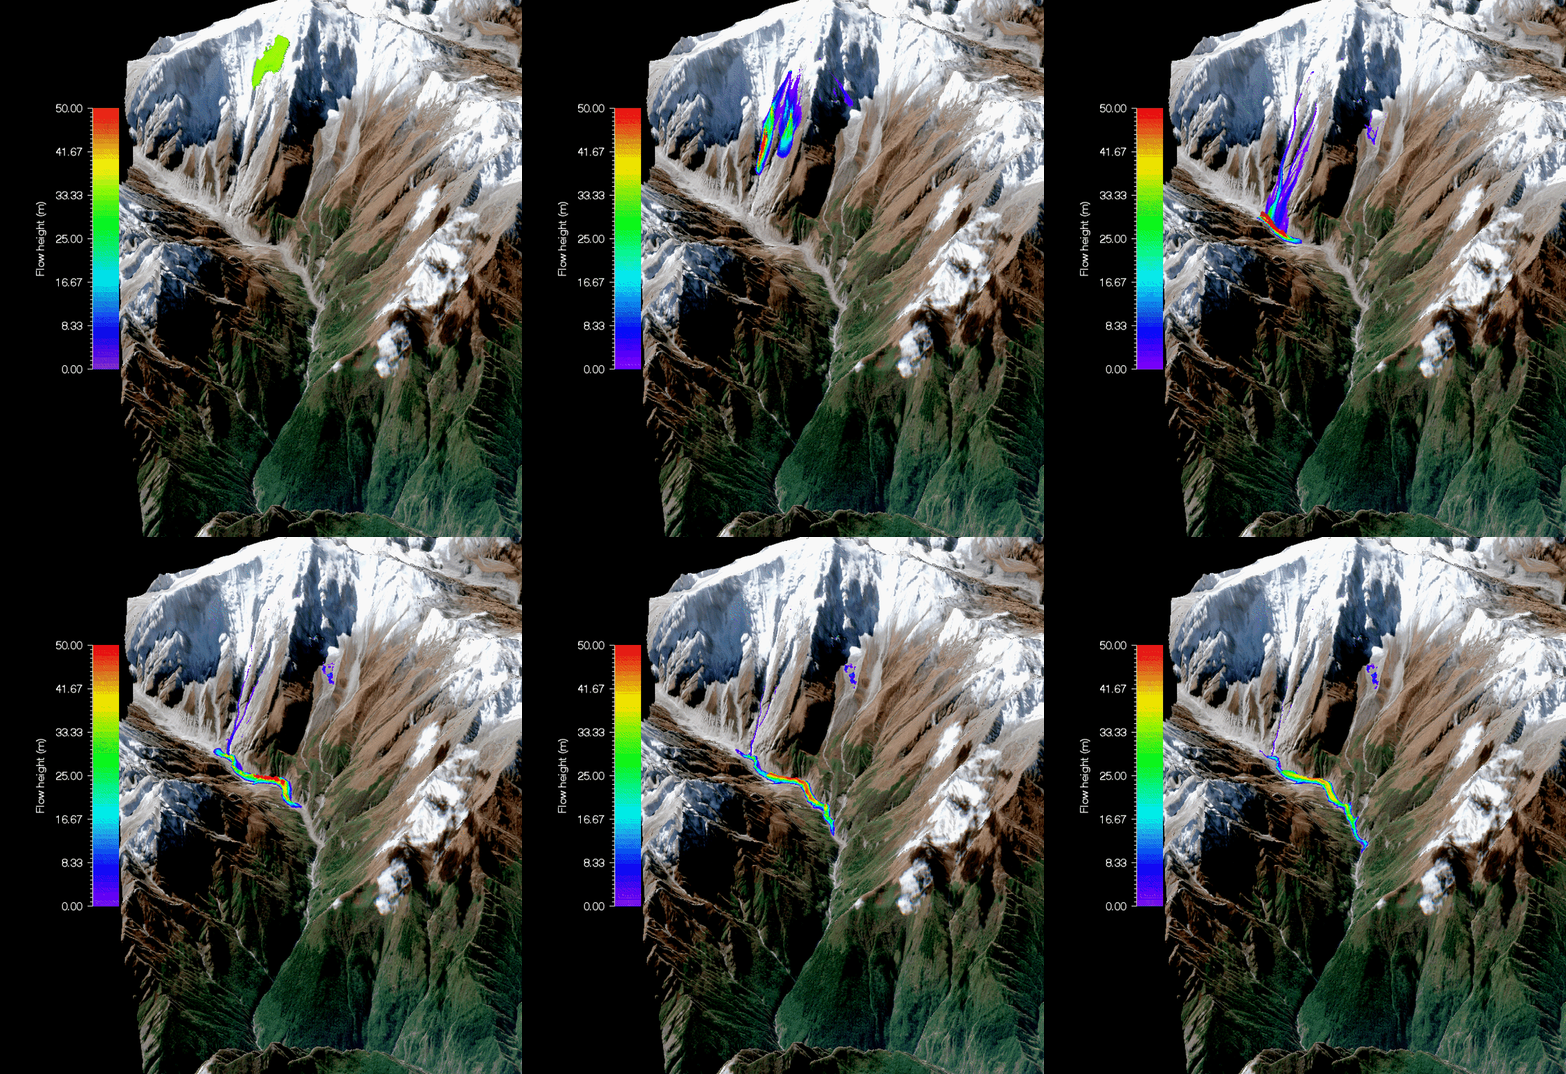
Using a thermomechanical model, we simulated the September 2016 event and the maximum pressure exerted by this event on the valley. We discovered it was 6,000 kilopascal (a measurement of compressive strength) – big enough to make visible changes in the valley profile by adding erodible sediments, which could worsen any future event.
Seasonal snow avalanches also keep this part of the valley sufficiently lubricated. We then simulated the 2021 event under two scenarios: the first without specifying the erosion characteristics of the remaining avalanche deposits from the past, and the second with the inclusion of defined erosional zones.
The results indicate that the remaining valley deposits from past ice and snow avalanches likely aided the volume and flow of the 2021 rock-ice avalanche – which would explain its exceptional reach to the downstream population.
Although the past ice avalanches of 2000 and 2016 did not inflict any direct damage to life and property, they are recurring events in this valley. But it is difficult to predict their future impact in combination with other glacial hazards, such as happened in the Chamoli disaster.
As climate change accelerates globally, such life-threatening scenarios are developing in other mountain regions too, with greater frequency and uncertainty. With satellites providing frequently updating images, understanding any patterns in these high-mountain hazards could help save many lives and protect expensive infrastructure in future.
Anshuman Bhardwaj is Senior Lecturer and Lydia Sam is Lecturer of Earth Observation and Planetary Sciences at University of Aberdeen.
This article first appeared on The Conversation.


