


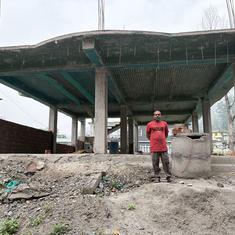


India’s booming business centres and gleaming shopping malls mask a grimmer reality. While one section of the population gets richer, another section gets poorer. In the countryside, farmers and others left behind by the economic surge find themselves in increasingly desperate circumstances. In many cases their plight, exacerbated by crippling debt, has led to suicide.
The widening gap between India’s rich and poor is captured by the National Sample Survey, an organisation founded in 1950, which gathers data from roughly 14,000 Indian villages and localities to provide a snapshot of how the population at large is faring. The National Sample Survey and its pioneering role in the measurement of poverty and inequality are were of the important subjects addressed by a conference from July 5 to July 7 in Cambridge that explored how different modern societies have measured social and economic disparity.
Since Indian Independence in 1947, the National Sample Survey has conducted more than 70 rounds of surveys, providing much-needed data about household consumption, social inequality, educational attainment and healthcare outcomes. National Sample Survey data serves as a backbone to Indian economic planning, public welfare provision and academic research.
The story behind the National Sample Survey goes back to 1913, when a brilliant young man called Prasanta Chandra Mahalanobis arrived at King’s College, Cambridge, to study mathematics. It is said that Mahalanobis had intended to become a student in London but applied to King’s after visiting its world-famous chapel and missing the last train back to the capital. He graduated with a BA in natural science, receiving top marks in his physics final exam.
During his time at Cambridge, he interacted with another outstanding Indian mathematician, Srinivasa Ramanujan. Influenced by the British journal Biometrika, Mahalanobis began experimenting with new statistical methods for studying and measuring large-scale phenomena – occurrences so widespread and diverse by nature that they are difficult to gauge.
A man of diverse scientific interests, Mahalanobis combined statistics with other emerging disciplines, including anthropology, physics and economics, to develop novel approaches for estimating population distribution, crop yields and household consumption.
Measuring inequality
Mahalanobis is known for his pioneering work in descriptive statistics – and his name is remembered by the “Mahalanobis distance”, a measurement used in studies of population. For many years he taught at Presidency College (Kolkata) where, in 1931, he was responsible for founding the Indian Statistical Institute.
Today the Indian Statistical Institute employs a staff of more than 1,000 people and is a leading international centre for research in applied mathematics, data science and computing.
With funding from the Philomathia Foundation, Dr Poornima Paidipaty (Faculty of History) has embarked on a study focusing on Mahalanobis’ most important contribution at the Indian Statistical Institute: his visionary work on the development of large-scale surveys of India’s rural population in response to the country’s drive to realign itself as an industrial force with global reach.
Her research is part of a much larger project on “Historicising the Measurement of Inequality”, which is directed by Dr Pedro Ramos-Pinto and examines global histories of quantifying and framing socio-economic disparity.
Starting in the late 1930s, the Indian Statistical Institute undertook a series of pioneering pilot surveys to gauge Indian household incomes at a time of huge social and historical upheaval. Sampling offered Indian scientists new tools for generating data on phenomena that had never been comprehensively or accurately measured before. In its early years as a research and training centre, the Indian Statistical Institute used sampling to study everything from changing patterns in tea consumption to estimating crop acreage.
This research became more urgent after Independence, when government planners needed more reliable economic data to frame programmes aimed at rapid industrialisation, poverty alleviation and development. Lacking a strong household income tax regime, Indian bureaucrats lacked the fine-grained statistical information used by economists in developed countries to accurately estimate GDP.
Mahalanobis and his colleagues at the Indian Statistical Institute offered a unique solution to these problems and designed a pioneering large scale sampling exercise to estimate the size, composition and condition of the Indian economy. As an approach to measurement, it was an original (and at the time, highly risky) endeavour. Many doubted that random sampling could accurately represent the totality of Indian social and economic life.
Building blocks
In 1950, Mahalanobis launched the National Sample Survey to undertake the ambitious task of providing a comprehensive picture of India’s domestic economy. In first rounds of research, 1833 villages and residential areas were surveyed. This limited sample was used to represent the nation as a whole, which totalled roughly 360 million people at the time.
During this early period, critics complained that urban areas were over-represented and that surveyors were unfamiliar with the struggles and transformations facing remote regions and rural villages. It took many years for Mahalanobis and colleagues to design a survey that would capture, with an acceptable level of accuracy, the data that the government sought.
Due in part to his widespread academic interests, and his interactions with intellectuals from fields other than mathematics, Mahalanobis’ work incorporated cutting edge research in the social and computational sciences of the post-war era. He collaborated with top economists and mathematicians from around the world, and brought leading scientists to Kolkata for extended periods of time.
Ronald Fisher, JBS Haldane, Norbert Wiener, Andrey Kolmogorov, Jerzy Neyman, Joan Robinson and Simon Kuznets were among the many researchers sponsored by the Indian Statistical Institute to collaborate on the Institute’s teaching and ongoing survey efforts in the 1950s and 1960s.
During its first decade, National Sample Survey researchers had to address numerous and complicated issues. What size and distribution of survey sites would best represent the nation in its entirety? How should surveyors account for India’s significant informal sector and for labour that was paid in kind, rather than cash?
Measuring national productivity required that researchers account for all productive labour – not just monetised transactions. Similarly, how should surveyors include women’s labour? Survey teams had to build rapport with their subjects, and in many cases, even teach them how to estimate monthly consumption and expenditure. The accuracy of data relied on social ties and mutual education – not just rote completion of questionnaires.
Over time, the National Sample Survey not only became a valued and relied upon institution, it influenced researchers and policymakers around the globe. Chinese officials sent their statisticians to Kolkata to learn from Mahalanobis’s staff in the 1950s, and the ISI served as a model for the American statistician Gertrude Cox, for the organisation of statistical training in the USA.
With her background in science studies and South Asian history, Paidipaty is well-equipped to understand the technical as well as the social relationships that allowed Indian planners and scientists to define and steer the national economy. Her research draws on the extensive archives of the Indian Statistical Institute, which offer unique insights as to how Indian household life was measured in the early decades after Independence and Partition, and how policymakers framed and understand shifting standards of living.
Precursor to big data
Paidipaty’s work demonstrates that sampling, as a technique of economic measurement, was intimately tied to mid-century economic planning. Under Nehru’s leadership, the Indian state focused its developmental efforts on rapid industrialisation and growth, but achieving these objectives required new tools for defining and measuring the national economy. What were the different, discreet parts of an economy and how did they relate to one another?
Pinning down such abstractions and offering concrete, tangible data, was indispensible to the work of managing India’s planned economy. The early history of sampling roughly overlapped with early experiments in economic planning. Mahalanobis was a member of India’s Planning Commission from 1953 until 1967, and directed the nation’s Second Five Year Plan.
In 2014, India’s government dissolved the Planning Commission, arguing that pro-growth policies ought to be achieved through unfettered markets rather than planned policy interventions. Yet, even without a formal planning apparatus, the significance of large-scale sampling has only grown over the last 70 years.
Since the 1980s, economists around the world, including those at the World Bank and the IMF, have embraced and underscored the importance household sampling. Not only do they provide large-scale aggregative statistics, they are a crucial source of fine-grained and qualitatively rich data.
The NSS has been an on-going subject of debate amongst economists, but is also a crucial source of information. Angus Deaton, the recipient of the 2015 Nobel prize in economics, in some of his most influential work used NSS data to help the Indian government recalibrate how it defined and measured poverty. Within the current Indian context, in which economic growth and rising inequality are once again at the centre of public debate, it has become all the more important to understand the history of data, how it is produced and what numbers really represent.
As a nation, India is undergoing profound transformation, but rapid growth has come hand in hand with rising inequality as well as growing disparity between rural and urban areas. National Sample Survey data remains one of the best resources for understanding and tracking these changes. As more of this information circulates in the public domain, it becomes all the more crucial to appreciate how such data is produced. Paidipaty’s work on the history of the National Sample Survey offers a fascinating glimpse into one of the most significant and early mid-century precursors to contemporary developments in big data.
This article first appeared on the University of Cambridge website.