


In their new book The Verdict: Decoding India’s Elections, Prannoy Roy and Dorab R Sopariwala, pioneers of Indian psephology, have looked into and analysed massive databases of past elections to identify that the trends that will matter the most in Elections 2019.
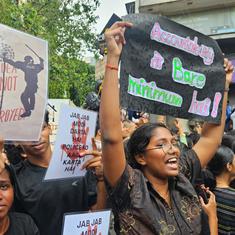
Their findings unpack many details, not all of them positive – for instance, they describe how over 21 million Indian women are missing from the electoral rolls. On the other hand, the number of women actually voting has grown to almost match, and sometimes surpass, their male counterparts.
Roy and Sopariwala spoke to Scroll.in about, among other things, the mind of the Indian voter, the impact of the SP-BSP alliance in Uttar Pradesh, and the complexities of forecasting elections. Excerpts from the interview:
You begin your book with a long discussion on the theme of anti-incumbency. Could you walk us through the various stages in the evolution of the Indian voter’s behaviour, from 1952 – the year of the first general election – till now? What are the various changes that you have discovered?
Prannoy Roy (PR): You know Dorab here was the first to coin the word “anti-incumbency”, and the book is replete with a lot of data dealing with the issue of anti-incumbency. We found that in the first 25 years, 1952 was the first election, till 1977, 80% of governments were voted back into power. Although governments hardly did anything for the people, there was very little development, all these elements reflected in what we now call the “Hindu rate of growth”, and in fact MPs would rarely go back to their constituencies, they would stay put mostly in Delhi, and come back to their constituencies only during election time. Despite all this, at that time, they would keep getting voted back again. Why?
Because that was the post-independence honeymoon phase. And this phenomenon is not exclusive to India, but happens in other developing countries as well, like South Africa. So the first 25 years of faith and hope and naiveté and trust. In fact the key word here is the phenomenon of the trusting voter. Things started changing from 1967 onwards.
In fact, 1967 is a very key year with the Congress beginning to split, and by this time they weren’t as dominant as they used to be earlier. Several other factors came to a climax in 1977, when the Congress government was voted out. This is the angry voter phase. The years between 1977 and 2002 were the time when over 70 percent of governments were thrown out – whatever they did, good or bad, even if they were good, they were still voted out.
The sense during this second 25-year-period in the minds of Indian voters was that they were being deceived by their leaders. Then in the years immediately leading towards 2002, slowly the politicians began to realise that 70% of the time, they were being chucked out. Now they started working for their constituencies. And within the voter too by this time, we see a palpable change taking place, where even they began to slowly distinguish between those politicians who worked hard and those who didn’t.
Since 2002, we have been in the phase of the discerning voter. The voter in this phase is much more mature and since 2002, 50 percent of governments have been voted out, and 50% voted back in. Generally those MPs and governments that do some work on the micro level, I am not talking about macroeconomic issues like GDP etc., but development at the local level, in the constituencies, are voted back in.
And curiously, you didn’t see flamboyance or great oratorial skills being a necessity to be re-elected. Take Naveen Pattnaik, not a flamboyant personality, but he was being voted in. Similarly, in Delhi, Sheela Dixit, not a great orator, but comes back three times. In Chhattisgarh, you have Raman Singh, and in Madhya Pradesh you have Shivraj Singh Chouhan. But these were doers. Narendra Modi too was voted back in Gujarat, and he was voted back not because of his oratory but because of his work.
Dorab Sopariwala (DS): Also important to note here is the lack of information about politics and politicians in the period from 1952 to 1977. In those days it was very hard to know, for a villager for example, about who your MP was, about what kind of development you need, and so on. You felt more powerless. Once the ’80s started, voters began to understand the power in their hands and with the boom in television, they began to be better informed about what was happening. All this also helped in making the Indian voter more discerning. So now we have the wise voter who thinks for their own benefit, weighs their leaders on the basis of who has done what for their particular constituency.
Let me latch on to this matter of information flow, which you deal with extensively in your book as well. Earlier the flow of information was not as seamless as it is now, when it is very easy for the voter to know what’s happening. But a parallel development, distinctly visible at least over the past five years, is taking place where the purveyors of this information – the media – have begun to grow less independent, more pro-government, almost to the point of toeing the official line. What impact do you see this development having on voting behaviour?
PR: This is an issue we have analysed quite closely over the years – the impact of the media and the disbursement of information on voting behaviour. And we have found that this impact of the media is a bit overrated. Let’s take the case of Tamil Nadu. Most of the prominent channels there are owned by the political parties, like Sun TV for example, owned by associates of the DMK. In this scenario, had the impact been big, DMK would have stayed on in power. But they have lost several elections. Take Punjab too, where the cable distribution of news is under one party, and yet they lost the last elections. And frankly there are several such examples.
In our study we have found that the reason the impact of biased media is very minimal on voting patterns is that voters are mature enough to discern that such and such a channel or media house is biased and there is no point trusting or believing them. Moreover, there is also the issue that development can be felt if it has taken place, one can see that the work of a particular government has brought in visible change in their constituency, which is irrespective of what media would or would not show. And these changes cannot be hidden. So one should not overestimate the impact of media in voting patterns. It is great in providing information, but when it comes to changing people’s minds, not so much.
DS: There is another factor which one needs to consider when studying voting behaviour. A political party already has a certain number of core voters. Using news media to preach to the converted doesn’t help. One needs to get new voters in. Very often, when the messaging is very shrill, you lose out on the new voters. You keep your converted people together, the best example is Donald Trump. He keeps his base intact by employing the shrillness of the news media. But it does not bring in the extra 10% or 15% of new voters, which can be crucial in an election.
Perhaps one of the biggest takeaways from your book, the one that has caught the headlines, concerns women voters. Let’s divide this into two parts. First, let’s talk about the rise in the number of women voting. What do you see as the impact of this rise in the 2019 elections, and how has this change panned out historically?
PR: Well, the Election Commission only began to give the male/female breakup from 1962. In that year, women were women were way behind men – 15% – in terms of voting participation in Lok Sabha elections, and 20% in State Assembly elections. That’s 15%-20%, which is a huge number in electoral terms.
Between then and now, in the last Lok Sabha election, women were only 1% behind. That itself is a massive change. And in the state assembly elections, women’s turnout has overtaken men’s turnout already, it is 1% higher in fact. These numbers where women’s turnout is higher than men’s were unthinkable in India. The trend will continue in this 2019 Lok Sabha elections too, with women perhaps overtaking men in terms of turnout for the first time in our history.
In our travels we saw long queues of women outside polling booths, which we never used to see before. Women are determined to participate in the political process, they are vocal, and what is, perhaps, more important, is that they vote independently. Particularly in South India, they are very vocal. In fact, we have asked several of them whether they consult their husbands while voting. The women just shrug and tell us no way would they depend on their husbands for opinion.
DS: You see voting patterns themselves have become very diverse. When we were on the field travelling, we interviewed a family and the man told us that he voted one way, his wife voted her own way, his mother voted another way. And each of these voting patterns was not arbitrary, but was buoyed by considerable reason.
What about the role of caste and religion in influencing voting patterns then? Let us take a certain percentage of women voters – within that particular percentage do caste and religion play any part at all? If they do, how much?
PR: That’s a very good question. Yes it does play a part. However, while caste plays a crucial role in many states, not all states, even where it is crucial, it is not en bloc. It is not that 100% of Yadavs will vote for Akhilesh’s Samajwadi Party or 100% of Jatavs will vote for Mayawati. And these are two of the biggest voting blocks we have. It is never 100%. It will be somewhere around 70% to 80%. There will definitely be trends, depending upon caste or religion, of voters favouring one party or another. These trends, however, are never absolute, and there are strong variations within them.
DS. Also please note that in a state as big as Uttar Pradesh, for example, you cannot become the chief minister by depending upon your core caste base. Mayawati is the best example. She rode to power not just on the basis of the Jatav votes, but by stitching together a broad caste alliance, which included the Brahmins.
This is also reflected in the ticket distribution by the parties themselves. You have Yadav candidates from all the big parties – BSP, SP, BJP and Congress. There are frequent cases when, in one particular constituency, all the candidates fighting are Yadavs. Everyone wants to get a piece of the action.
PR: Brahmins are an interesting example, in fact. About 65% vote for BJP, while 35% tend to vote more for the SP first, then the BSP, and then the Congress. Now in popular understanding, Brahmins as a caste grouping is usually understood to be a BJP versus Congress battle. Not true. While caste matters, but it is not everything.
Now let me come to the second part of the question concerning women voters. One of the striking findings in the book is about the missing women voters. You peg the number at 21 million, which is huge. Why are only women voters affected? Are there a corresponding number of men voters missing as well? And are the reasons for this administrative, or are greater powers at play here?
PR: When it comes to the number of men voters it is actually the opposite. There are more men on the electoral rolls than there should be. Because men migrate from one state to another or from a village to a city in search of work, there is a lot of duplication in the number of men voters. And the election commission, quite rightly, is quite liberal in allowing migrants to register in two places.
As far as missing women are concerned, we took the conservative estimate and reached the figure of 21 million. We went to the Election Commission, they told us to use a different method of calculating. Which we did. It came out to be 28 million, which is even worse.
And we did go into this issue in sufficient detail to find out that it is not really the fault of the EC. They have tried a lot. One of the objectives of the book is to raise questions and let others find out why. A lot of research has to be done as to why this is the case. Some of the reasons are social. To get a voter ID, a photograph is required. In many families, daughters or daughters-in-law are not allowed to be photographed. We also suspect, and we don’t have data to back this up, but the women voters who are missing are primarily from the poorer sections of society, who have not registered.
DS: This phenomenon is found mainly in the northern states, not in the southern states. Many of the villages are cut off from the mainland, there is no connectivity, officers of the Election Commission do not want to travel into these parts. It is too large a number to be ignored.
You have also spent a considerable portion of your book talking about opinion polls. Would you walk us through the evolution of opinion polls in India? And if you could explain the methodological aspects of conducting opinion polls, and how to get these polls right?
PR: As far as the father of opinion polls is concerned, the laurel rests with a man named Eric De Costa. Eric De Costa used to employ a methodological tool called the Congress Multiplier, which didn’t work out in many circumstances. But his method did have an element of rationality to it. Then there was a lull, and the Congress was anyway winning most of elections. Then there were a couple of us, Ashok Lahiri and I, who were at that time in the Delhi School of Economics – he is a great statistician while I was an election fanatic since I was 12.
I had watched opinion polls on television in England and elsewhere, and I was obsessed with them. So we went to Aroon Purie, he was at India Today and that was the main magazine in India. And Purie was fabulous. For him to listen to us seriously, trust us, fund opinion polls and publish the findings was a huge deal. We were mainly theoreticians, and Dorab was already in the field of market research. So we got together, we conducted the opinion polls, which were quite accurate, but we were a bit cautious too. We started this in 1980, and till about 1990, we were still among the very few. And then the field of opinion polling just blossomed.
In an opinion poll, as you have written, what is crucial is to get the trend right, instead of obsessing over sensitive numbers like the number of seats a party would win. Why this reliance on trends?
PR: We have a database of 833 polls. We found out from it that 97% of the time, the opinion polls have got the winner right (if one election, 2004, is excluded – in 2004 every single poll got their forecast wrong). By winner, I mean who is going to be the largest party. But a very high percentage get the number of seats wrong. You get the largest party right, but you are very far off concerning the number of seats.
With polls you can only measure votes, you cannot measure the number of seats. The conversion of votes to seats is a hugely complex and difficult exercise. So if you have say a 3% error in votes, that translates into getting a whopping 45-55 seats wrong. So staying with a certain margin of error in a first-past-the post system, you may get your votes with a 3% margin of error, but the corresponding error in calculating the number of seats is quite massive.
Because of this exaggeration in the conversion of votes to number of seats, when using the tools of forecasting it is essential that we first get the votes right through on-ground surveys, using electoral rolls and many other ways. Once you have got that, the next part is to convert it into the number of seats. This is tricky, and as anyone in the polling business knows, conversion is quite tough. And 1% can mean at least 15-18 seats. Everyone is a bit cautious. So then we are in a scenario where most opinion polls underestimate the number of seats the winner will get.
For this conversion of votes to seats, you have also used a particular criterion in your book called the Index of Opposition Unity (IOU). With 2019 as your focus, how do you see the IOU playing out? And could you explain, theoretically, the correlation between the IOU and number of seats?
PR: So what you have to measure is the margin of victory in each constituency. And by definition, it’s not even a relationship, the margin of victory depends upon the swing in votes – which is basically how much one party gets compared to last time – and the change in the Index of Opposition Unity. These two factors determine the margin of victory.
What has happened over the years is that in the first 50 years of our elections, 66% of seats were won or lost depending upon popularity, and only 33% depending on a divided or united Opposition. But now the relationship between popularity and the IOU has become almost 50-50. In simple terms, the Index of Opposition Unity has become crucial in winning or losing elections. So, say in Uttar Pradesh, if the two primary parties – the SP and the BSP – had come together last time, the BJP would have won half the number of seats that it actually did.
In many states, in fact, the IOU is even more crucial than popularity. In fact, if you see the data, parties are winning elections with a lower and lower percentage of votes. The BJP polled roughly 31% in 2014, and the NDA roughly 38%, and formed the government. Why? Because over the years the opposition has been more divided, and subsequently the IOU has been lower. So with narrower margins, even a small change in opposition unity can translate into a huge change in the number of seats. And the IOU works in any state, not just in those states where the Congress and the BJP are going head-on. In Kerala, where there really are just two fronts – the Left Front and the Congress – the IOU is massive, about 85%, way above the national average.
DS: Political parties have come to the realisation that they are not winning because they are not united. So instead of losing out altogether, parties are now compelled to come together, because there is no other way.
PR: In the earlier days, there used to be an unwritten rule: the enemy of my enemy is my biggest enemy. Because you as a political party want to take that space and be the only opposition. Then they began to realise that such an approach was counterproductive. And I must say one last thing, the BJP is way better, both historically and even this time around, in forging alliances, than the Congress. They know how to compromise, reduce their own seats, and concede a little bit more to their alliance partners.
Staying with Uttar Pradesh a little longer, you have the SP and BSP who have come together this time. Now the received wisdom is that between these two parties, while the BSP’s votes are transferable to the SP, it does not happen the other way round.
PR: This is a myth. Everybody assumes that to be the case, but is not true. First, it’s very complex to prove this one way or the other. It is just an assumption that people make. But if there is any evidence in the data, which we have looked at, it is that the voters tend to do exactly what their leaders say. The SP transfers, and so does the BSP. What’s more interesting is that when they form an alliance, they get not only the sum total of their votes, they get a little extra boost too.
So if you look at these by-elections that took place – Kairana and Gorakhpur – not only did the alliance get the sum total of the SP/BSP votes, but plus 10% [in one constituency] and plus 4% [in another]. So the fact that they got together drives home the view that they are now a more serious contender, they are serious about the election, and it’s not a wasted vote. So when parties come together, votes are additive plus a boost.
DS: I would like to also add here that the UP elections are going to depend a lot on the voter turnout. Cadre-based parties like the BJP and the CPI(M) are very efficient in getting their voters to the booth.
PS: With the SP and the BSP, you need to also remember that these are the two parties with the largest number of loyal core voters. With the BSP, 85% of their core voters vote the same way, and with the SP, the core voting percentage is 80%. Not so much with Congress and the BJP, whose numbers are around 50%-55%. So the SP and BSP can ensure that their core voters vote according to the party line. And I would also like to point out that by not having the Congress on board, it is going to make a big difference this time. The Congress might have just about 6 percent vote share in UP, but the corresponding correlation in terms of seats would have been huge.
Now that you are travelling, what are the trends that you see on the ground? Have the Pulwama incident and the Balakot strikes had an impact on the ground?
PR: The situation on the ground, at least in UP which we are covering now, is not very different from what it was in 2017. UP is a little bit more polarised this time around. There are the core Modi supporters – not BJP, but only Modi – and there are those who are just angry. The cow problem is much bigger than what we thought. Farmers are spending nights in the fields trying to stop the cows from eating up their crops, because once cows stops giving milk, they can no longer be sold, they ares just allowed to become stray cattle. It is a very sad sight. And the people are very unhappy with it. They are unhappy also because the farming community feels neglected. I can say, compared to 2017, although I am not sure in terms of percentages, the views are much more polarised.
DS: Pulwama and Balakot cannot hurt the BJP is all I can say. I am not sure how much benefit they will derive from it.
PR: During our travels we really did not see Balakot as emerging as a key factor. And like Dorab said, it’s not going to hurt the BJP.
DS: You see, it’s like Trump and his wall. It is meant to energise the core supporters. Which Pulwama and Balakot might do for the BJP. But then they would have voted for Modi anyway. The crucial factor is always ths – will it bring in new voters to the BJP?
PR: It is also clear that in this election the Muslims, the Dalits and the Yadavs are voting together. There is some divide among the Muslims between the SP/BSP and the Congress. In our calculation, we found the numbers to be around 80-20 – 80% of the Muslims going for the SP/BSP alliance, and 20% for the Congress.
