


The Indian government argues that lockdown has successfully reduced the spread of the novel coronavirus epidemic, while some critics argue that it has largely failed. Where does the truth lie? What exactly does the available data coupled with modelling tell us?
The politics of lockdown
The effects of lockdown on disease cannot – and should not – be looked at in isolation. They are entwined with its political and humanitarian effects, including unemployment, hunger, an unprecedented migrant worker crisis, and widespread loss of access to healthcare. These crises could have been averted or lessened with planning, but they are now an essential part of India’s lockdown story. So what might have motivated the hasty decision to lock down?
When a complex and unclear threat is unfolding, you can see the appeal of a lockdown to those in power. It reframes disease control in terms of restrictions on movement and contact. Messy narratives about health infrastructure, testing, tracing, monitoring, probabilities, education, research and so forth, are replaced with a list of rules, responsibilities and consequences. The relationship between authorities and people is simplified: the authorities enforce the rules, the people comply.
Moreover, it is almost self-evident that a sufficiently rigorous lockdown must “work” – if we are willing to ignore all the realities of what such rigorous lockdown would entail. There is now an obvious culprit for any failure to control disease – the lockdown violator – and the narrative of lockdown helps build support for solutions based on surveillance.
A second effect of lockdown – also convenient for the central government – is that it “localises” both disease and politics. Because people, and hence infection, cannot move freely, the epidemic takes very different paths in different regions. Consequently, responses to it need to be local, and the responsibility for day-to-day disease control passes to state governments or municipal corporations.
As the national picture becomes increasingly complicated, the Centre takes on a more symbolic and supervisory role. Dashboards of “performance” in different states shift perceptions of responsibility and place pressure on state governments. It is they who become the villains when there is failure to control the disease, even where national policy may be to blame. The blame game encourages states to manipulate data including finding ways to underreport Covid-19 infections and deaths.

Lockdown and disease spread
Lockdown has two overlapping effects on disease, and modelling suggests that distinguishing between them is important for understanding the situation in India. First, lockdown slows the transmission of the virus by enforcing physical distancing. Second, it slows the geographical spread of disease – the localisation discussed above. Neither effect is absolute, of course. Poor lockdown planning led to panic and overcrowding, probably accelerating transmission for a while. And within some localities, for instance in Mumbai, hindering freedom of movement might actually have accelerated disease by stopping outflows of people which could have reduced population density.
The first lockdown effect, a slowdown in transmission, occurs via a reduction in those day-to-day events which spread disease. This can be modelled simply as a reduction in the probability of infection events occurring. It should manifest in the data after a delay. If transmissions are cut in half today, and testing typically occurs 10 days after infection, then 10 days from now recorded infections will start to slow. About 18 days from now, we will see deaths start to slow.
The second effect – geographical localisation – can be modelled most simply as a reduction in the effective population where disease is able to spread. Of course, localisation can never be perfect: disease leaks – across state boundaries, within a town, or even within an urban neighbourhood. Nevertheless, after lockdown begins, we expect fewer outbreaks in new localities. The outbreaks which fail to occur would take time to become numerically significant – hence, their absence takes time to be visible in data. We see clearly the signature of localisation in the flat data curves of outbreaks which have effectively been controlled such as that in Germany.
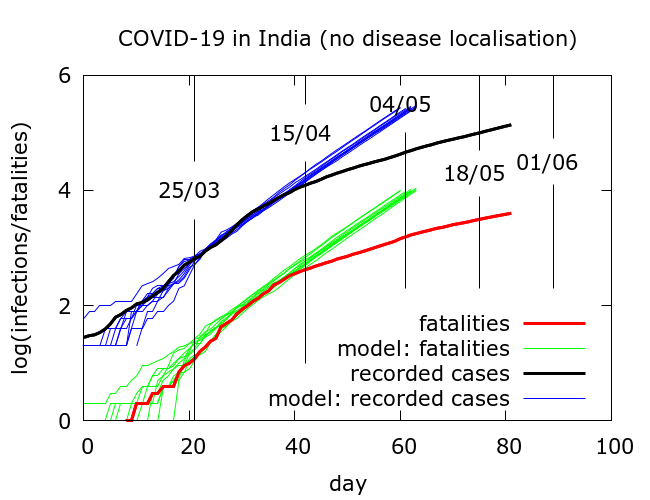
We can use data from Maharashtra to demonstrate the difference between the effects of a drop in transmission and disease localisation. The graph below shows data on confirmed infections in Maharashtra taken from this volunteer-led database, along with simulations of four scenarios:
- No mitigation
- Lockdown causes only a reduction in transmission: roughly, there is some physical distancing, but people move freely
- Lockdown only localises the disease: roughly, there are restrictions on movement, but no additional physical distancing
- Full lockdown with both effects
 reached 10 million.")
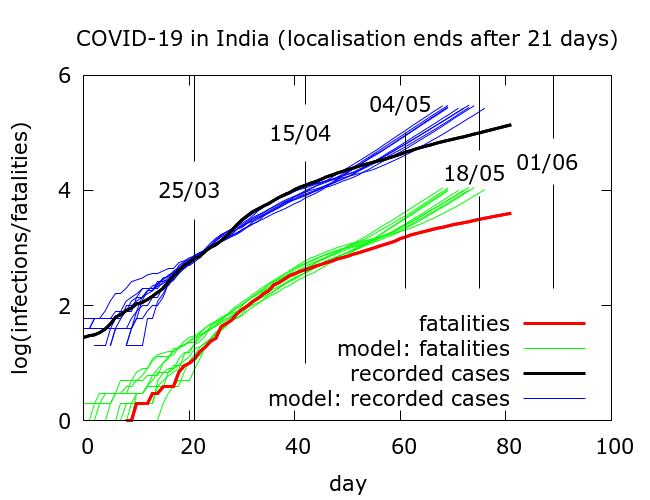
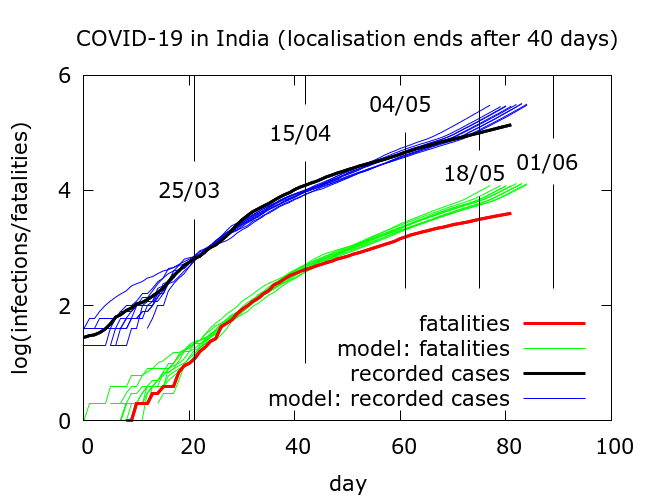
Until about 10 days into the lockdown, all the modelled curves approximately match the number of cases recorded in the state – there are some fluctuations due to the random nature of the processes involved. After this, the curve for no mitigation rapidly diverges from the recorded data. The curve for reduced transmission without localisation diverges more slowly from the data: people are more careful, but travel freely. The curve for localisation without reduced transmission diverges and then heads back towards the data: people live their lives as before, except for being more confined in their movements. Finally, the curve with both effects matches the recorded number of cases well.
These results suggest that the data is best explained by considering both effects of lockdown: an immediate drop in transmission caused by increased physical distancing, and a slower change caused by geographical localisation of disease. While a drop in transmission slows the rise in numbers in the short term, it is disease localisation which “flattens” the curve in the long term. In this sense, it is perhaps localisation which is the more important of the two effects.
Effectiveness of lockdown in India
In state data such as that examined above, we see the clear signature of the lockdown. Nationally, how effective have the lockdowns been?
When we model the national data in aggregate, we find both reduction in transmission and localisation of the disease have had an impact. Focussing on the latter effect, we can cautiously try to quantify the effects that disease localisation has had.
If we assume a fatality rate of 0.5%, then model simulations tell us that, as of May 22, there have been about three million infections nationwide, heavily concentrated in a few hotspots. Testing has picked up roughly 4% of these and about a third are currently infectious. We can now use the model to explore the effects of an abrupt end to disease localisation. Roughly, this would correspond to the sudden resumption of free movement at pre-lockdown levels, although with physical distancing continuing as before.
With no disease localisation to begin with, that is, no lockdown as such, total infections would already, by around May 5, have reached 20 million – more than six times the current estimated infections. If localisation had ended after the first phase of lockdown on April 15, the rise would have started after a short delay, and 20 million infections would have been reached around mid-May. And so forth. In short, modelling suggests that a resumption of free movement, whenever it occurs, leads eventually to a steep rise in infection.

The results of such simulations come with some important caveats. When we model national data, we are actually averaging over data from different states with quite divergent dynamics.
First, as far as the impact of the lockdown on reduction in transmission goes, when we examine statewise data, we see that there was significant regional variation in the strength of this effect. In those states where initial transmission was rapid, the lockdown had a bigger impact. This is natural – we would expect more dramatic consequences of a lockdown in those areas where transmission was higher. Modelling finds that between 30% and 60% of transmission events occurring per day were removed around the time of lockdown. These numbers vary by region, and depend on model assumptions. They should be treated with caution.
Second, the way that the lockdown localised disease led to very different patterns of infection in different states. We see these patterns in state-wise data, and in the widely varying levels of infection that different groups of migrant workers carried when some were eventually able to return home.
Finally, hypotheticals should always be viewed with some scepticism. The simulations in the graph above rely on the implausible assumption that if not for lockdown no other mitigation would have occurred. In reality, even without full lockdown, travel restrictions could be enforced to localise disease to some extent. Nevertheless, the message is that lockdown effectively stopped new outbreaks and consequently greatly reduced numbers, and lifting restrictions on movement leads, after some delay, to more rapid spread.
Conclusions
So, are the critics of lockdown wrong? If they argue that lockdown has failed to slow Covid-19 in India, then, yes – but few people would make such a sweeping claim. Rather, the main criticism is that lockdown was a blunt instrument, poorly planned and cruelly implemented. This led to a lot of unnecessary misery which continues today. It also perhaps took attention away from other more sustainable strategies for disease control such as ramped up testing and tracing.
Another valid criticism is that although lockdown has slowed disease, it has definitely not contained it. According to modelling, active infections nationwide today are about 35 times higher than at the start of lockdown. Although this is much less than would have been the case without lockdown, it is nevertheless a large pool of active infection. It means that any sudden return to pre-lockdown conditions could allow numbers to rapidly increase. In the most optimistic scenarios I have modelled, active cases are currently reaching a plateau and will soon slowly descend. But these scenarios assume no easing of measures and I consider it more likely that peak is still some way off nationally.
Are there lessons to learn from the whole lockdown story so far? First, instead of voodoo maths, decisions should be based on transparent data. We need to be estimating prevalence and using credible modelling to track the progress of the epidemic locally. Serosurveying currently in progress is a welcome development in this direction. Unfortunately, data fudging and using unhelpful statistics to shore up a narrative have become widespread both at the Centre and in some states, making the task of monitoring the epidemic harder.
The most dramatic lockdown mistake was to bar migrant workers from returning home at a point when disease levels were low and any resulting spread could have been quite easily contained. The migrant crisis teaches us first and foremost that both epidemiological and humanitarian consequences of any major move should always be considered carefully in advance.
As restrictions are eased and more people travel home or return to work, robust mechanisms are needed to monitor and contain the new outbreaks which might follow. These mechanisms for disease surveillance must, of course, rely on transparency, communication and building trust.
Murad Banaji is a mathematician with an interest in disease modelling. The modelling on which this article is based is described in more detail here.