


The 2014 General Elections’ verdict was stunning in many ways. It produced the first single-party majority in the Lok Sabha since 1984 and the first majority obtained by a non-Congress party, the Bharatiya Janata Party. Record numbers were attained in terms of turnout, campaign expenses, media coverage and deployment of electoral machinery. The Congress suffered its worst defeat in 129 years, much worse than its 1977 defeat, after the Emergency.
What emerges from these results is a new form of political power – new at least for the two or three generations that have come of age in the post-Indira Gandhi years. A single individual seems to be running the show, with a compact government and within a reinforced Prime Minister's Office, free from the shackles of coalition politics.
BJP and Narendra Modi at the head of the government will determine whether these elections are the beginning of a new era or, more modestly, would have been a landmark change in the ways politics is done in India.
Before we are able to pass judgment on the historic character of these elections, we must look at the results analytically, pointing at continuities and discontinuities, and contextualise these results with past elections.
The following series of charts and maps provide this analytical contextualisation of the results. They do not cover the whole range of possible angles or topics but do shed some light on the processes that have led to an election verdict that will remain engraved in memory for long. Note that these analytics do not diminish the merit of the BJP’s victory, its significance or its legitimacy. They merely aim at situating the BJP’s performance in a wider context and should hopefully help readers to decide whether they want to call these elections truly historical or not.
1. The Competition
The 2014 election was contested by 484 parties, which is 121 more than in 2009 and nearly the double of the number of parties that contested in 2004. This inflation of the number of parties did not impact very much the outcome as most of them failed to get any votes. The number of parties represented in Parliament actually slightly decreased, from 39 to 35.
Further, 8,159 candidates contested, out of which 6,959 (or 85%) forfeited their deposit, which means that they gathered each less than one-sixth of the total votes polled in their constituency. This ratio is actually quite stable compared to previous elections.
2. The BJP’s performance
These two maps clearly show that the BJP victory is before all a Hindi heartland victory. Barring Karnataka, the BJP has not pierced the southern states, and the eastern coastal states, up till West Bengal. The second map shows the Congress performance – or rather the lack of it – but also marks that it came second in 224 seats. Presented differently, all the white parts are the areas where the national parties either did not contest or came out third or lower.
In terms of victory margin, the BJP’s success is striking. The average vote share of winners was 47% and the average vote share of the runner-up 32%. A 15% average margin is a very high number and a clear indication of the BJP’s surge in popularity.
This is not to say that the BJP has not progressed outside its traditional strongholds. It has in fact progressed quite impressively in states it did not use to perform, like West Bengal or Kerala. In Calcutta, the BJP comes second behind the Trinamool in the two Kolkata seats. But all these votes hardly translated into any seat: two in West Bengal (same as the Communist Party of India [Marxist]), one in Kerala, one in Tamil Nadu, for the first time.
The question we can then ask is was this result really a national verdict, or a sign of the nationalisation of the party system? In terms of vote share, this is the lowest vote share ever necessary to produce a majority of seats – 31%. That is to say 31% of 66.4% of participation, or 139.5 million voters, that is 17% of the total voting population. This is much lower than the vote share obtained in any other single party majority election.
The previous four single-party majorities required a minimum of 40% of vote share. They also produced larger majorities. The 2014 majority is the shortest majority obtained by a single majority party.
3. Decimation of the Congress
This is the worst defeat of the Congress 129 years. It got only 44 seats, with a 19% vote share. In the Hindi heartland, the party has been reduced to seven seats, five less than its previous comprehensive defeat in 1977, when if faced the competition of the entire opposition united behind the Bharatiya Lok Dal banner, to become the Janata Party.
Even in 1977, the Congress managed to maintain itself in the south and still retained 27% of total vote share. In 2014, the Congress losses have been comprehensive.
4. Uttar Pradesh
The Uttar Pradesh performance of the BJP in Uttar Pradesh was undoubtedly the biggest surprise of these elections. The BJP won 71 out of 80 seats, leaving the crumbs to other parties’ leaders. For the first time since it contested elections, the BSP draw a blank.
In terms of vote share, the rise of the BJP is truly spectacular, from 17.5% to 42.34%. The Congress collapses to 7.48%, the Bahujan Samaj Party loses near 8% of vote share, at 19.63%. The Samajwadi Party maintains its vote share, losing 1% of votes compared to 2009.
If we look in more details, we see that the BJP vote share surpasses the combined vote share of SP, BSP and Congress and allies in 22 constituencies, essentially cities and Western UP seats (but not only).
5. Vote seats distortion
When we compare the 2009 and 2014 results, we see that the BJP is currently at 3% vote share higher than where the Congress was in 2009, and that the Congress is actually 1% ahead from where the BJP was in 2009 (18%).
So the margin between the first and the second party went from 10% to 11%, with an inversion of the two national parties. This swing has created an important distortion of seats, in favour of the BJP.
The explanation for this comes from the First Past the Post electoral system which, in a fragmented polity, creates a disproportion effect, further reinforced when the dispersion of votes around the national parties is large. In the Hindi heartland, for instance, 45% of the votes brings the BJP 86% of the seats. The Congress with 19.5% of the votes gets only 3% of the seats, which is worst than its previous low record of 12 seats, post-Emergency.
6. The strength of regional parties
A good illustration of this disproportionality effect of the electoral system is the collective strength of the regional parties. Despite the massive vote swings and seats variations of the Congress and the BJP, the representation of regional parties remains equal – at 212 seats – with the same vote share (46.6% against 46.7% in 2009).
Only five regional parties manage to get more then 3% of vote share and the gap between the largest regional party and the Congress is 15%.
However, this apparent stability of the regional parties’ score hides important variations among them. Put simply, the northern regional parties, of the Hindi belt, have been wiped out the Lok Sabha, despite sometimes good performances. The SP and BSP combined still represent 42% of vote share, the Janta Dal (United) and Rashtriya Janata Dal 38%.
At the same time, regional parties contesting outside the Hindi Belt, in states where the BJP was not a serious contender, have had their field day, thanks to the collapse of the Congress. The All India Anna Dravida Munnetra Kazhagam, the Biju Janata Dal, the Trinamool, and three regional parties in Andhra Pradesh completely dominate their state.
If one looks at the main regional parties performance within their state, one can appreciate their resilience. Even parties who suffered considerable loss of seats, such as the SP or the Dravida Munnetra Kazhagam – have maintained their vote share. The most striking result is the null score of the BSP, despite 19% of vote share in Uttar Pradesh.
In conclusion, even if many regional parties have suffered a blow in these elections, one should not write them off, as they remain very relevant within their state and would prove tough contenders in upcoming assembly elections.
7. The Rajya Sabha
The BJP still does not have a majority at the Rajya Sabha, where it will have to compose with regional parties. It currently holds less than one-fifth of the seats and both national parties hold less than 100 seats together.
8. Representation of women
There are 62 women MPs in the 16th Lok Sabha, which is the highest number ever but still very far from the one-third recommended quota by the supporters of a women’s reservations quota.
Of them, 23 women MPs come from Uttar Pradesh and West Bengal alone, the rest being dispersed in very small numbers among the rest of the states. Jharkhand and Haryana haven’t sent a single woman to the Lok Sabha.
Party-wise, the Trinamool, the Aam Aadmi Party and the BSP have distributed the most tickets to women.
This marginal increased in the number of women MPs is not to be credited to the BJP, which traditionally fields less women candidates than the Congress, barring in 2009 when both parties fielded 43 women each.
That being said, the success rate of the BJP’s women candidate was much higher than any other party, owing to the overall good performance of the BJP. The second party with the highest success ratio is the Trinamool, with 10 out of its 25 women candidates elected.
Women represented 7.9% of the total candidates and represent 11% of the elected MPs. The reason is that mainstream parties and national parties tend to field more women and that they tend to be more successful than small parties and independent candidates.
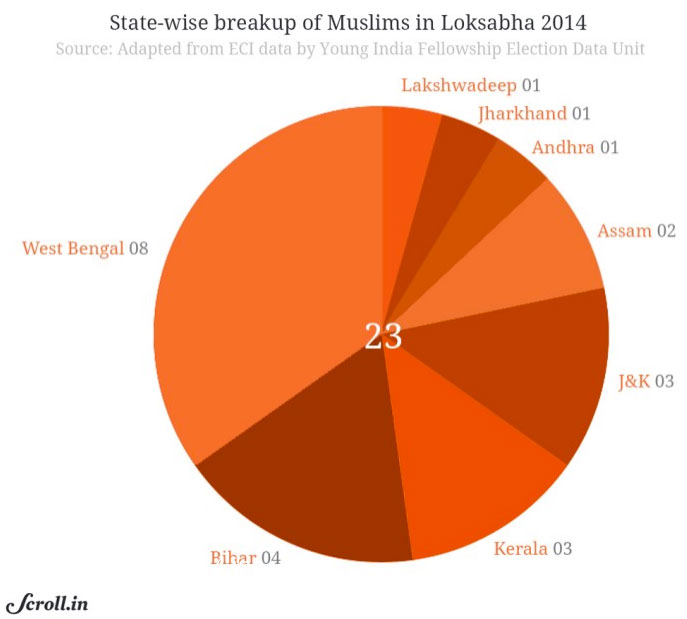
9. Representation of Muslims
With 23 Muslims, the representation of Muslims is the lowest since 1952. For the first time also, the ruling party does not have a single Muslim MP.
To make things more difficult, these 23 MPs come from eight different states and 11 different parties, which means that not only they won’t be a cohesive presence in the assembly but that in addition they won’t even weigh anything within their own parties. For the first time also, UP does not have a single Muslim representative.
10. NOTA
For the first time in general elections, voters had the option to reject all candidates by pressing the None of the Above button. 1.1% of voters chose to do so. But when we break up the results, we can see that the constituencies who voted the most for NOTA are reserved seats in rural areas, predominantly in Naxal areas.
Nineteen constituencies registered a NOTA vote share higher than the winning margin. One cannot say however if the absence of NOTA would have changed the outcome in these seats.
11. Winners' and runner-ups’ profile
Despite their poll drubbing, Congress’ candidates trailed in 224 constituencies.
The 16th Lok Sabha is richer and more criminal than the 15th, thanks to the BJP largely, although Congress candidates were collectively richer, even when we remove information technology baron Nandan Nilekani, who skews the data with his fortune. So when we compare the winners versus the runner-ups, we see that the runner-ups were actually richer and the winners more criminal.
The criminal profile of candidates makes for good headlines. Here is a map showing he share of candidates struck with serious crime charges, per state. Here is the ranking per state.
If we compare the profile of the winners and runner-ups, there is no straight-forward relation between winning and having a criminal profile. Runner-ups in Uttar Pradesh, West Bengal and Tamil Nadu tend to be substantially more criminals than the winners.
12. Urban and rural voters
One might have thought that given the amplitude of the victory of the BJP, the urban-rural divide would not make much difference. Actually, the vote share of the BJP in urban seat is considerably higher than its national average, at 41%. An astounding 84% of the BJP urban candidates won. This is a reverse and amplified image from 2009, when the BJP actually won more votes in rural seats.
13. “Phase effect”
Many have questioned whether stretching the polls over nine phases affected the results. It’s a complicated question but here are some observations. The Modi wave dipped after the 5th phase of the elections to rebound when the BJP toughened its campaign and Narendra Modi started campaigning intensively in Varanasi. During the various phases of the elections, the Congress’ vote share gradually decreased and fell brutally after the 7th phase. One must of course take into consideration the areas that were polling in each phase. But interestingly, the collapse of the Congress corresponds to the rebound of the Modi wave on the web, measured here by Google Trends.
14. Accuracy of opinion polls
NDTV-Hansa predicted the results the most closely, with 275 seats for the NDA combine. All polls universally predicted a much better performance from the Congress-led UPA though, predicting somewhere between 92-117.
In terms of vote share, India Today and ABP-Nielson predicted an exact 23% vote share for the UPA. India today and NDTV were close in predicting NDA’s vote share.
The exit polls predicted BJP-led NDA to win between 257 and 340 seats, with a variation of 80 seats between them, according to the six exit polls as shown in the visualisation. The wide variation in numbers led analysts to believe that the exit polls could go wrong this time as well.
Conclusion
In conclusion, there is no denying that the BJP performance is out-of-the-ordinary. Not so much in terms of vote share and seats – here the BJP is more a meta-regional party than a completely national party, despite the progress in the east and south. But in terms of vote share in seats won, the BJP comes way ahead of its competitors, particularly in the Hindi Belt. The performance of the BJP in the Hindi Belt is what changes the balance of power between national and regional parties.
Regional parties remain strong and a force to reckon with at the regional level. The coming assembly elections will be crucial to understand the sustainability of the BJP wave.
There are no significant changes however as far as the winner’s profile is concerned – in terms of gender, religion or crime. Assets data, not shown here as their face value is to be doubted, seem to indicate that the new Lok Sabha has a higher combined wealth than the previous one, which is a continuation of a long-term trend.
What Narendra Modi and the BJP will do of this result is what will determine whether these elections were a landmark of sorts.
[Members of the YIF Electoral Data Unit: Tanuj Lalit Bhojwani, Santosh Sundaresan, Sai Krishna K., Shahzaib Ahmed, Saswati Das, Monica Hariharan, Nikita Saxena, Sourya Donkada, Anand Kumar, Praveen Kangtha, Sabarinathan Selvaraj, Karthik Sivaram, Aafaque Raza Khan. Gaurav Mehta. Infographics: Kaustubh Khare (YIF) and Neha Dani (Scroll.in)]
We welcome your comments at
letters@scroll.in.
What emerges from these results is a new form of political power – new at least for the two or three generations that have come of age in the post-Indira Gandhi years. A single individual seems to be running the show, with a compact government and within a reinforced Prime Minister's Office, free from the shackles of coalition politics.
BJP and Narendra Modi at the head of the government will determine whether these elections are the beginning of a new era or, more modestly, would have been a landmark change in the ways politics is done in India.
Before we are able to pass judgment on the historic character of these elections, we must look at the results analytically, pointing at continuities and discontinuities, and contextualise these results with past elections.
The following series of charts and maps provide this analytical contextualisation of the results. They do not cover the whole range of possible angles or topics but do shed some light on the processes that have led to an election verdict that will remain engraved in memory for long. Note that these analytics do not diminish the merit of the BJP’s victory, its significance or its legitimacy. They merely aim at situating the BJP’s performance in a wider context and should hopefully help readers to decide whether they want to call these elections truly historical or not.
1. The Competition

The 2014 election was contested by 484 parties, which is 121 more than in 2009 and nearly the double of the number of parties that contested in 2004. This inflation of the number of parties did not impact very much the outcome as most of them failed to get any votes. The number of parties represented in Parliament actually slightly decreased, from 39 to 35.
Number of contesting candidates and candidates having saved their deposit
Further, 8,159 candidates contested, out of which 6,959 (or 85%) forfeited their deposit, which means that they gathered each less than one-sixth of the total votes polled in their constituency. This ratio is actually quite stable compared to previous elections.
2. The BJP’s performance
Seat performance of national parties – winners and runner-ups
These two maps clearly show that the BJP victory is before all a Hindi heartland victory. Barring Karnataka, the BJP has not pierced the southern states, and the eastern coastal states, up till West Bengal. The second map shows the Congress performance – or rather the lack of it – but also marks that it came second in 224 seats. Presented differently, all the white parts are the areas where the national parties either did not contest or came out third or lower.

In terms of victory margin, the BJP’s success is striking. The average vote share of winners was 47% and the average vote share of the runner-up 32%. A 15% average margin is a very high number and a clear indication of the BJP’s surge in popularity.

This is not to say that the BJP has not progressed outside its traditional strongholds. It has in fact progressed quite impressively in states it did not use to perform, like West Bengal or Kerala. In Calcutta, the BJP comes second behind the Trinamool in the two Kolkata seats. But all these votes hardly translated into any seat: two in West Bengal (same as the Communist Party of India [Marxist]), one in Kerala, one in Tamil Nadu, for the first time.

The question we can then ask is was this result really a national verdict, or a sign of the nationalisation of the party system? In terms of vote share, this is the lowest vote share ever necessary to produce a majority of seats – 31%. That is to say 31% of 66.4% of participation, or 139.5 million voters, that is 17% of the total voting population. This is much lower than the vote share obtained in any other single party majority election.
The previous four single-party majorities required a minimum of 40% of vote share. They also produced larger majorities. The 2014 majority is the shortest majority obtained by a single majority party.
3. Decimation of the Congress

This is the worst defeat of the Congress 129 years. It got only 44 seats, with a 19% vote share. In the Hindi heartland, the party has been reduced to seven seats, five less than its previous comprehensive defeat in 1977, when if faced the competition of the entire opposition united behind the Bharatiya Lok Dal banner, to become the Janata Party.
Even in 1977, the Congress managed to maintain itself in the south and still retained 27% of total vote share. In 2014, the Congress losses have been comprehensive.
4. Uttar Pradesh
The Uttar Pradesh performance of the BJP in Uttar Pradesh was undoubtedly the biggest surprise of these elections. The BJP won 71 out of 80 seats, leaving the crumbs to other parties’ leaders. For the first time since it contested elections, the BSP draw a blank.
Party performance in Uttar Pradesh, seat-wise, 2009-'14
In terms of vote share, the rise of the BJP is truly spectacular, from 17.5% to 42.34%. The Congress collapses to 7.48%, the Bahujan Samaj Party loses near 8% of vote share, at 19.63%. The Samajwadi Party maintains its vote share, losing 1% of votes compared to 2009.
Seat and vote share of main parties in Uttar Pradesh (1989-2014)
If we look in more details, we see that the BJP vote share surpasses the combined vote share of SP, BSP and Congress and allies in 22 constituencies, essentially cities and Western UP seats (but not only).
BJP vote share vs combined vote share of SP-BSP-INC/RLD
5. Vote seats distortion
When we compare the 2009 and 2014 results, we see that the BJP is currently at 3% vote share higher than where the Congress was in 2009, and that the Congress is actually 1% ahead from where the BJP was in 2009 (18%).
National Vote share of INC and BJP (1991-2014)
National Seat share of INC and BJP (1991-2014)
So the margin between the first and the second party went from 10% to 11%, with an inversion of the two national parties. This swing has created an important distortion of seats, in favour of the BJP.

The explanation for this comes from the First Past the Post electoral system which, in a fragmented polity, creates a disproportion effect, further reinforced when the dispersion of votes around the national parties is large. In the Hindi heartland, for instance, 45% of the votes brings the BJP 86% of the seats. The Congress with 19.5% of the votes gets only 3% of the seats, which is worst than its previous low record of 12 seats, post-Emergency.
6. The strength of regional parties
A good illustration of this disproportionality effect of the electoral system is the collective strength of the regional parties. Despite the massive vote swings and seats variations of the Congress and the BJP, the representation of regional parties remains equal – at 212 seats – with the same vote share (46.6% against 46.7% in 2009).

Only five regional parties manage to get more then 3% of vote share and the gap between the largest regional party and the Congress is 15%.

However, this apparent stability of the regional parties’ score hides important variations among them. Put simply, the northern regional parties, of the Hindi belt, have been wiped out the Lok Sabha, despite sometimes good performances. The SP and BSP combined still represent 42% of vote share, the Janta Dal (United) and Rashtriya Janata Dal 38%.
At the same time, regional parties contesting outside the Hindi Belt, in states where the BJP was not a serious contender, have had their field day, thanks to the collapse of the Congress. The All India Anna Dravida Munnetra Kazhagam, the Biju Janata Dal, the Trinamool, and three regional parties in Andhra Pradesh completely dominate their state.
State-wise vote share and seat share of regional parties
Source: Adapted from ECI data.
If one looks at the main regional parties performance within their state, one can appreciate their resilience. Even parties who suffered considerable loss of seats, such as the SP or the Dravida Munnetra Kazhagam – have maintained their vote share. The most striking result is the null score of the BSP, despite 19% of vote share in Uttar Pradesh.
In conclusion, even if many regional parties have suffered a blow in these elections, one should not write them off, as they remain very relevant within their state and would prove tough contenders in upcoming assembly elections.
7. The Rajya Sabha
The BJP still does not have a majority at the Rajya Sabha, where it will have to compose with regional parties. It currently holds less than one-fifth of the seats and both national parties hold less than 100 seats together.

8. Representation of women

There are 62 women MPs in the 16th Lok Sabha, which is the highest number ever but still very far from the one-third recommended quota by the supporters of a women’s reservations quota.

Of them, 23 women MPs come from Uttar Pradesh and West Bengal alone, the rest being dispersed in very small numbers among the rest of the states. Jharkhand and Haryana haven’t sent a single woman to the Lok Sabha.

Party-wise, the Trinamool, the Aam Aadmi Party and the BSP have distributed the most tickets to women.

This marginal increased in the number of women MPs is not to be credited to the BJP, which traditionally fields less women candidates than the Congress, barring in 2009 when both parties fielded 43 women each.

That being said, the success rate of the BJP’s women candidate was much higher than any other party, owing to the overall good performance of the BJP. The second party with the highest success ratio is the Trinamool, with 10 out of its 25 women candidates elected.

Women represented 7.9% of the total candidates and represent 11% of the elected MPs. The reason is that mainstream parties and national parties tend to field more women and that they tend to be more successful than small parties and independent candidates.
9. Representation of Muslims
With 23 Muslims, the representation of Muslims is the lowest since 1952. For the first time also, the ruling party does not have a single Muslim MP.


To make things more difficult, these 23 MPs come from eight different states and 11 different parties, which means that not only they won’t be a cohesive presence in the assembly but that in addition they won’t even weigh anything within their own parties. For the first time also, UP does not have a single Muslim representative.
10. NOTA

For the first time in general elections, voters had the option to reject all candidates by pressing the None of the Above button. 1.1% of voters chose to do so. But when we break up the results, we can see that the constituencies who voted the most for NOTA are reserved seats in rural areas, predominantly in Naxal areas.

Nineteen constituencies registered a NOTA vote share higher than the winning margin. One cannot say however if the absence of NOTA would have changed the outcome in these seats.
11. Winners' and runner-ups’ profile

Despite their poll drubbing, Congress’ candidates trailed in 224 constituencies.

The 16th Lok Sabha is richer and more criminal than the 15th, thanks to the BJP largely, although Congress candidates were collectively richer, even when we remove information technology baron Nandan Nilekani, who skews the data with his fortune. So when we compare the winners versus the runner-ups, we see that the runner-ups were actually richer and the winners more criminal.
The criminal profile of candidates makes for good headlines. Here is a map showing he share of candidates struck with serious crime charges, per state. Here is the ranking per state.


If we compare the profile of the winners and runner-ups, there is no straight-forward relation between winning and having a criminal profile. Runner-ups in Uttar Pradesh, West Bengal and Tamil Nadu tend to be substantially more criminals than the winners.
12. Urban and rural voters

One might have thought that given the amplitude of the victory of the BJP, the urban-rural divide would not make much difference. Actually, the vote share of the BJP in urban seat is considerably higher than its national average, at 41%. An astounding 84% of the BJP urban candidates won. This is a reverse and amplified image from 2009, when the BJP actually won more votes in rural seats.
13. “Phase effect”

Many have questioned whether stretching the polls over nine phases affected the results. It’s a complicated question but here are some observations. The Modi wave dipped after the 5th phase of the elections to rebound when the BJP toughened its campaign and Narendra Modi started campaigning intensively in Varanasi. During the various phases of the elections, the Congress’ vote share gradually decreased and fell brutally after the 7th phase. One must of course take into consideration the areas that were polling in each phase. But interestingly, the collapse of the Congress corresponds to the rebound of the Modi wave on the web, measured here by Google Trends.
14. Accuracy of opinion polls

NDTV-Hansa predicted the results the most closely, with 275 seats for the NDA combine. All polls universally predicted a much better performance from the Congress-led UPA though, predicting somewhere between 92-117.

In terms of vote share, India Today and ABP-Nielson predicted an exact 23% vote share for the UPA. India today and NDTV were close in predicting NDA’s vote share.

The exit polls predicted BJP-led NDA to win between 257 and 340 seats, with a variation of 80 seats between them, according to the six exit polls as shown in the visualisation. The wide variation in numbers led analysts to believe that the exit polls could go wrong this time as well.
Conclusion
In conclusion, there is no denying that the BJP performance is out-of-the-ordinary. Not so much in terms of vote share and seats – here the BJP is more a meta-regional party than a completely national party, despite the progress in the east and south. But in terms of vote share in seats won, the BJP comes way ahead of its competitors, particularly in the Hindi Belt. The performance of the BJP in the Hindi Belt is what changes the balance of power between national and regional parties.
Regional parties remain strong and a force to reckon with at the regional level. The coming assembly elections will be crucial to understand the sustainability of the BJP wave.
There are no significant changes however as far as the winner’s profile is concerned – in terms of gender, religion or crime. Assets data, not shown here as their face value is to be doubted, seem to indicate that the new Lok Sabha has a higher combined wealth than the previous one, which is a continuation of a long-term trend.
What Narendra Modi and the BJP will do of this result is what will determine whether these elections were a landmark of sorts.
[Members of the YIF Electoral Data Unit: Tanuj Lalit Bhojwani, Santosh Sundaresan, Sai Krishna K., Shahzaib Ahmed, Saswati Das, Monica Hariharan, Nikita Saxena, Sourya Donkada, Anand Kumar, Praveen Kangtha, Sabarinathan Selvaraj, Karthik Sivaram, Aafaque Raza Khan. Gaurav Mehta. Infographics: Kaustubh Khare (YIF) and Neha Dani (Scroll.in)]