


How actually “sweeping” were these elections? The question might seem odd or misplaced, given the thumping victory that AAP just got. Sixty seven seats out of 70 is a figure that speaks for itself. But could a closer look at the results tell us something more nuanced that the jhaadu metaphors and allegories currently used to qualify AAP’s victory? Or do the details confirm that this was indeed a historical verdict?
As a starter, turnout data, vote share data, and their geography offer better indications on the amplitude of AAP’s performance than the number of seats. Then a look at constituency-level swings will give an idea of the amplitude of vote variations, compared to the 2013 elections.
A high turnout, but not the highest
With 67.08% turnout, Delhi registered its best turnout since 1972, the first assembly election held in the capital since 1952. It is however slightly lower than the turnout in the 2014 general elections (68.5%).

The spatial distribution of turnout reveals that participation was significantly higher in poorer seats, in the northeast and in the eastern constituencies. Most of the seats that registered the highest turnout are reserved seats, like Seemapuri and Gokalpur in the East, Karol Bagh and Patel Nagar in the Centre-West, or Sangam Vihar, Deoli and Ambedkar Nagar in South Delhi.
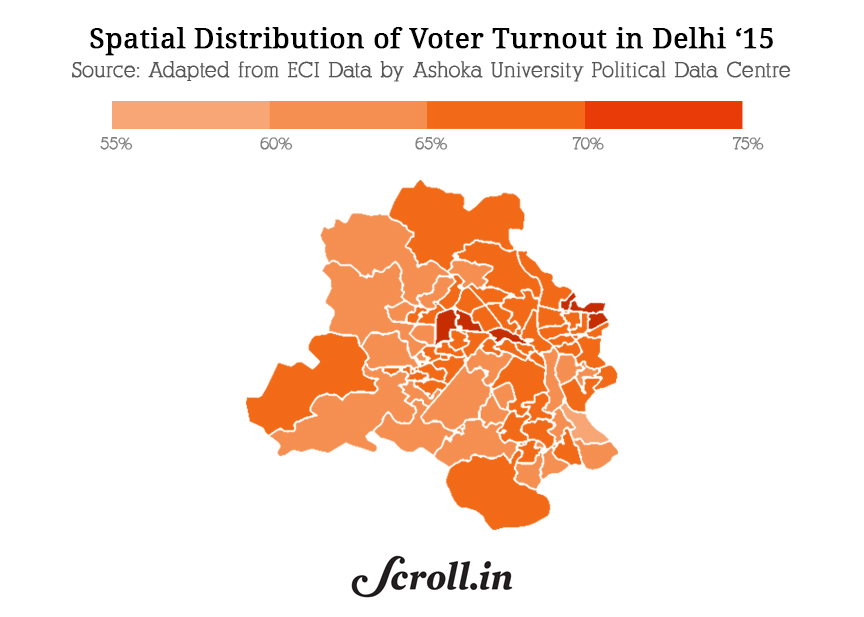
These observations show that issues of disenfranchisement of poor voters in Delhi – a genuine source of concern – did not prevent some of the poorest seats to vote en masse.
Delhi’s largest majority ever
Then, with 54.3% of vote, AAP registers the highest vote share ever obtained by any party in Delhi. Single majorities are frequent in Delhi elections, but never has a party won such a large number of seats with such a large number of votes. AAP beats Congress’ inaugural vote share performance of 1952 and the Janata Party performance of 1977 by nearly 2%.

This means that the BJP accommodates itself poorly with a truly bipolar fight. Its 2015 vote share does not differ greatly from the previous two elections (2013 and 2014). But with the non-BJP vote consolidating behind AAP, it could not convert its minority of votes into a larger number of seats, as it did in 2014 pan-India. In the 2014 general elections, the BJP got 52% of seats with 31% vote share. It gets this time 4% of the seats with 32.2% of the votes.

A comparison of the vote share of the three main parties in 2013, 2014 and 2015 shows that AAP grew between 2013 and 2015 by 25%, almost exactly the vote share that Congress had in 2013. In 2015, the Congress retains 10% of vote share, meaning that AAP could also consolidate about 11% of the votes that was previously scattered across Independents and marginal parties’ candidates.
The Congress registered its lowest vote share ever in the capital. It is remarkable to observe that in 38 seats, the BJP’s margin over Congress is actually higher – and generally much higher – than the margin that separates it with AAP. Congress candidates stand at a very distant third place in nearly all but 7 constituencies, where its margin with the BJP runner-up candidate is below 10,000 votes. In geographical terms, the Congress is reduced to a marginal presence of 10 to 15% vote share in a tiny pocket in East Delhi.

Largest vote share gap
We know that small numbers in Indian elections can create large effects. In theory, AAP could have obtained a similar result in terms of seats with a lower vote share gap. But with 22.1%, the distance between the winning party and its runner-up is enormous.
These large gaps are uncommon but not rare in bipolar fights. Himachal has twice recorded larger gaps – above 20%, in 1977 and 1985. Tamil Nadu is another state that sees huge vote swings between elections, turning into large vote gaps between the AIADMK and the DMK.

In Delhi, only the 1977 assembly elections, which saw the victory of the Janata party, comes close to AAP’s performance.
A consistent vote share
A cursory look at the geography of the results reveals that AAP’s vote share distribution is remarkably consistent. 54 seats were won within the 45%-60% vote share bracket covering all parts of Delhi, including some of the richest and poorest constituencies.
The BJP, at this vote share level (and not that it makes any difference), shows lower vote share consistency, performing better in South, South-East and North Delhi, comparatively.

The swing thing
A third way to assess the amplitude of a victory is to breakdown the vote share variation into constituency-level variations, or swings. The vote swings registered between 2013 and 2015 are massive. A previous case of strong result reversal was when Congress won Delhi in 1998, after having lost it to the BJP in the previous election. It then recorded a 13.8% vote share increase, with a fairly flat and consistent constituency-level swing.

Constituency-level swings are useful as they show how widespread results changes are and whether they constitute a “wave” or not.
25% of vote share increase is of course a massive change but the variations across seats show that the wave was clearly stronger in some constituencies, a good third of them. As it happens, these strong swing constituencies are those where AAP registered its lower scores in 2013.
A comparison with Congress’ negative swings is another way to visualize that AAP’s gains were Congress’ losses.
BJP’s stable result hides some variation of results across constituencies. It loses less than 1% of votes overall but gains in 25 seats (by a maximum of 12%).
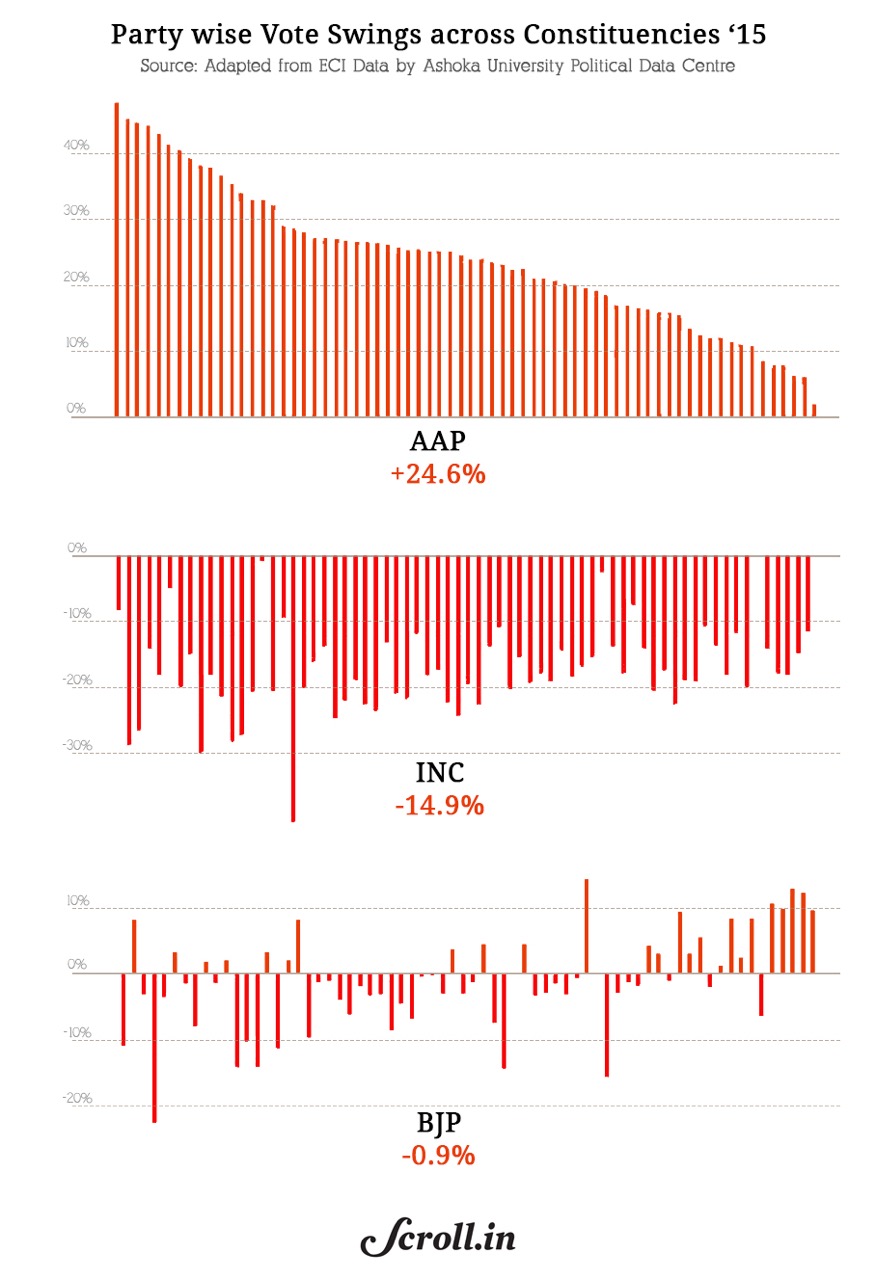
This actually reinforces the idea of consistency of results, as previously less-performing seats caught up with the more performing seats, which themselves saw a substantial increase of their vote share.
Conclusion
The conclusion is simple. You can twist the data in any way you like, what comes out is the extraordinary consistency of the results, through Delhi’s territory. Proper survey data will soon give us insights on how different groups of voters have cast their votes, and whether AAP drew its support consistently across classes and castes, or not.
One of the main learning of these elections is that the traditional levers of electoral politics have not produced their usual results and that a new register of politics could supplant them. One needs not necessarily divide the electorate on caste or class lines to secure majorities through the disproportionality effect of the electoral system, as it has been the trend in state politics in North India in recent years, and in the last General elections.
Recent BJP campaigns have been consistent in mixing an overall inclusive political discourse with divisive ground campaign practices, to enable it precisely to convert minorities of votes into majorities of seats. In 2014, the religious polarization strategy ensured the BJP some of its strongest vote shares in Western Uttar Pradesh. AAP actually did better in Delhi, obtaining 60% and above vote share in 11 seats. These results were obtained by targeting voters from all backgrounds, matching the inclusiveness of the party’s discourse with inclusiveness in its electoral practices.
The second learning is that the BJP can be defeated if the opposition gathers their forces – or if one party succeeds in consolidating the non-BJP vote. This simple logic should not escape the attention of the proponents of the Janata Party 2.0 in Bihar and Uttar Pradesh. They would do well to look at the Delhi polls and draw lessons from it.
Finally, the Congress can find solace in the fact that a party can succeed with the kind of politics some of its leaders aspire to do. The fact that this comes at the cost of its near annihilation might still however give them some sleepless nights.
Gilles Verniers is a political scientist at Ashoka University. Infographics by Kaustubh Khare.
We welcome your comments at
letters@scroll.in.
As a starter, turnout data, vote share data, and their geography offer better indications on the amplitude of AAP’s performance than the number of seats. Then a look at constituency-level swings will give an idea of the amplitude of vote variations, compared to the 2013 elections.
A high turnout, but not the highest
With 67.08% turnout, Delhi registered its best turnout since 1972, the first assembly election held in the capital since 1952. It is however slightly lower than the turnout in the 2014 general elections (68.5%).
The spatial distribution of turnout reveals that participation was significantly higher in poorer seats, in the northeast and in the eastern constituencies. Most of the seats that registered the highest turnout are reserved seats, like Seemapuri and Gokalpur in the East, Karol Bagh and Patel Nagar in the Centre-West, or Sangam Vihar, Deoli and Ambedkar Nagar in South Delhi.
These observations show that issues of disenfranchisement of poor voters in Delhi – a genuine source of concern – did not prevent some of the poorest seats to vote en masse.
Delhi’s largest majority ever
Then, with 54.3% of vote, AAP registers the highest vote share ever obtained by any party in Delhi. Single majorities are frequent in Delhi elections, but never has a party won such a large number of seats with such a large number of votes. AAP beats Congress’ inaugural vote share performance of 1952 and the Janata Party performance of 1977 by nearly 2%.
This means that the BJP accommodates itself poorly with a truly bipolar fight. Its 2015 vote share does not differ greatly from the previous two elections (2013 and 2014). But with the non-BJP vote consolidating behind AAP, it could not convert its minority of votes into a larger number of seats, as it did in 2014 pan-India. In the 2014 general elections, the BJP got 52% of seats with 31% vote share. It gets this time 4% of the seats with 32.2% of the votes.
A comparison of the vote share of the three main parties in 2013, 2014 and 2015 shows that AAP grew between 2013 and 2015 by 25%, almost exactly the vote share that Congress had in 2013. In 2015, the Congress retains 10% of vote share, meaning that AAP could also consolidate about 11% of the votes that was previously scattered across Independents and marginal parties’ candidates.
The Congress registered its lowest vote share ever in the capital. It is remarkable to observe that in 38 seats, the BJP’s margin over Congress is actually higher – and generally much higher – than the margin that separates it with AAP. Congress candidates stand at a very distant third place in nearly all but 7 constituencies, where its margin with the BJP runner-up candidate is below 10,000 votes. In geographical terms, the Congress is reduced to a marginal presence of 10 to 15% vote share in a tiny pocket in East Delhi.
Largest vote share gap
We know that small numbers in Indian elections can create large effects. In theory, AAP could have obtained a similar result in terms of seats with a lower vote share gap. But with 22.1%, the distance between the winning party and its runner-up is enormous.
These large gaps are uncommon but not rare in bipolar fights. Himachal has twice recorded larger gaps – above 20%, in 1977 and 1985. Tamil Nadu is another state that sees huge vote swings between elections, turning into large vote gaps between the AIADMK and the DMK.
In Delhi, only the 1977 assembly elections, which saw the victory of the Janata party, comes close to AAP’s performance.
A consistent vote share
A cursory look at the geography of the results reveals that AAP’s vote share distribution is remarkably consistent. 54 seats were won within the 45%-60% vote share bracket covering all parts of Delhi, including some of the richest and poorest constituencies.
The BJP, at this vote share level (and not that it makes any difference), shows lower vote share consistency, performing better in South, South-East and North Delhi, comparatively.
The swing thing
A third way to assess the amplitude of a victory is to breakdown the vote share variation into constituency-level variations, or swings. The vote swings registered between 2013 and 2015 are massive. A previous case of strong result reversal was when Congress won Delhi in 1998, after having lost it to the BJP in the previous election. It then recorded a 13.8% vote share increase, with a fairly flat and consistent constituency-level swing.
Constituency-level swings are useful as they show how widespread results changes are and whether they constitute a “wave” or not.
25% of vote share increase is of course a massive change but the variations across seats show that the wave was clearly stronger in some constituencies, a good third of them. As it happens, these strong swing constituencies are those where AAP registered its lower scores in 2013.
A comparison with Congress’ negative swings is another way to visualize that AAP’s gains were Congress’ losses.
BJP’s stable result hides some variation of results across constituencies. It loses less than 1% of votes overall but gains in 25 seats (by a maximum of 12%).
This actually reinforces the idea of consistency of results, as previously less-performing seats caught up with the more performing seats, which themselves saw a substantial increase of their vote share.
Conclusion
The conclusion is simple. You can twist the data in any way you like, what comes out is the extraordinary consistency of the results, through Delhi’s territory. Proper survey data will soon give us insights on how different groups of voters have cast their votes, and whether AAP drew its support consistently across classes and castes, or not.
One of the main learning of these elections is that the traditional levers of electoral politics have not produced their usual results and that a new register of politics could supplant them. One needs not necessarily divide the electorate on caste or class lines to secure majorities through the disproportionality effect of the electoral system, as it has been the trend in state politics in North India in recent years, and in the last General elections.
Recent BJP campaigns have been consistent in mixing an overall inclusive political discourse with divisive ground campaign practices, to enable it precisely to convert minorities of votes into majorities of seats. In 2014, the religious polarization strategy ensured the BJP some of its strongest vote shares in Western Uttar Pradesh. AAP actually did better in Delhi, obtaining 60% and above vote share in 11 seats. These results were obtained by targeting voters from all backgrounds, matching the inclusiveness of the party’s discourse with inclusiveness in its electoral practices.
The second learning is that the BJP can be defeated if the opposition gathers their forces – or if one party succeeds in consolidating the non-BJP vote. This simple logic should not escape the attention of the proponents of the Janata Party 2.0 in Bihar and Uttar Pradesh. They would do well to look at the Delhi polls and draw lessons from it.
Finally, the Congress can find solace in the fact that a party can succeed with the kind of politics some of its leaders aspire to do. The fact that this comes at the cost of its near annihilation might still however give them some sleepless nights.
Gilles Verniers is a political scientist at Ashoka University. Infographics by Kaustubh Khare.