


The Aam Aadmi Party’s historic victory stems from the promise of a different politics, on an aspiration for change. Is the new assembly – very much an AAP assembly – reflective of that change? A quick look at education levels, age and assets of candidates, as well as the representation of women and Muslims in the assembly, reveal much continuity and some novelty.
In terms of education level, AAP candidates were marginally more educated than its opponents (44 graduates and more, compared to 41 for the BJP and 35 for Congress). The share of highly educated candidates among AAP is also higher in 2015, compared to 2013.
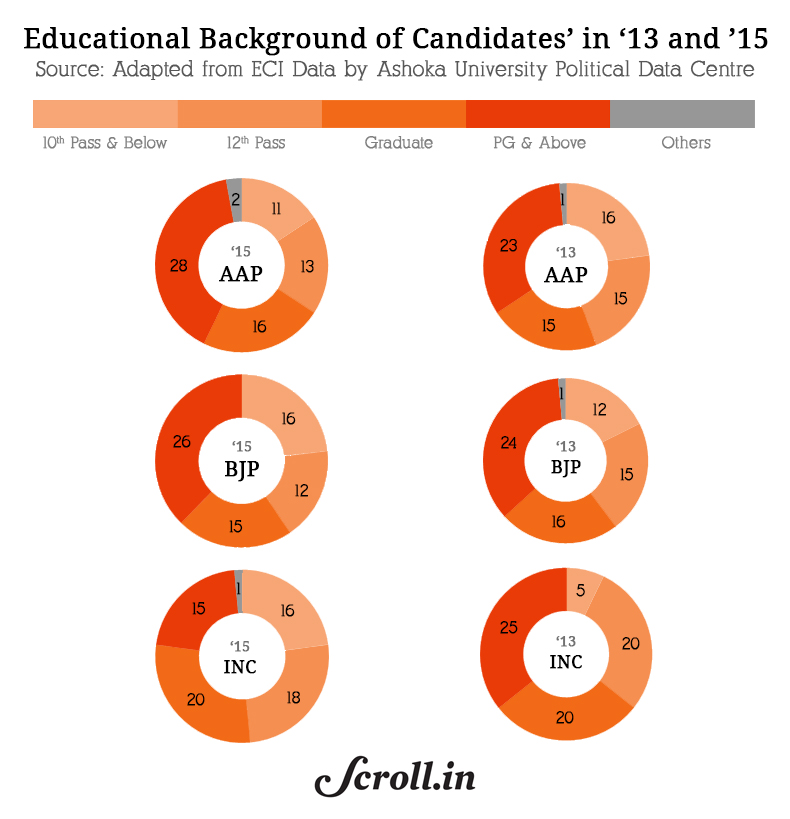
Despite its image of being a “tech party” and Arvind Kejriwal’s own background as an IIT engineer, the qualifications of AAP candidates tell their own story: there are only five engineers, 23 hold a social science or arts degree (B.A.(pass) being the most common degree), seven a law degree, four a business degree and only three have a science degree (including one medical doctor). The 26 remaining candidates are below graduate level.
As a contrast, the BJP’s candidates were predominantly either below graduate level (28) or social science and arts graduates (26). The party list contains more lawyers (11) and less graduate professionals (one engineer, one business studies and two science graduates). One BJP candidate, a 47 year-old multi-millionaire, still awaits the results of his B.A. final year (pending 2015).
The youngest ever?
AAP candidates were significantly younger than their opponents. With an average age of 44, the new Delhi Assembly is probably one of the youngest, if not the youngest, in India ever. The 2015 AAP candidates were comparatively younger than the 2013 lot. The BJP and Congress are on a similar and stable distribution in both elections.

In 2015, 42 out of 70 candidates from AAP are below the age of 45, more than twice the numbers of BJP and Congress.
Rich like them
Perhaps the more surprising figure is the fact that the AAP candidates situated in the Rs 1 crore-Rs 10 crores assets are in 2015 in equal number with the Congress, and marginally more numerous than the BJP candidates in the same bracket. However, there were significantly more AAP candidates in the lower segment (below Rs 30 lakhs of assets) and significantly less AAP candidates in the higher segments (Rs 10 crore and above). The asset distribution roughly reflects the distribution of education levels across candidates.

What about Aam Aurats?
Can the Aam Admi Party also claim to be an Aam Aurat Party? Not really. The distribution of women candidates and MLAs is strikingly similar across parties.

Past election results reveal that this trend is also quite stable. What is also striking is that the overall number of candidates is decreasing over the years, contrary to opposite trends observed in most other states.

In that regard, Delhi is not at all showing the way, the representation of women having at least marginally risen in most recent Assembly elections, including in Haryana.
Muslims’ representation
One can assume that AAP succeeded in capturing the essential part of the Muslim vote, one of the Congress’ last bastions in Delhi in the previous election. That swing did not take place on the basis of ticket distribution to Muslim candidates (five from AAP and Congress and one for the BJP). The number of elected Muslim representatives remains stable (four) and in fact, the overall number of Muslim candidates has significantly decreased since a peak in 2008.

What does this say about AAP? Obviously, one assembly never resembles another, even if the profile distribution of MLAs is similar. There are many reasons to think that AAP MLAs differ from the “traditional” Delhi politicians.
The defining character of this new assembly – and of the party that almost entirely occupies it – is its young age. In that sense, the AAP victory also has an important generational dimension, contradicting the notion that the BJP is young India’s preferred choice. The data does not say whether young voters voted more for AAP than the BJP. Only survey data will show that. But it is safe to assume that young voters are likely to be more attracted by a party showing a younger face than by the sometimes-geriatric candidates of traditional parties.
As for the rest, on basic indicators, AAP candidates don’t differ much from other parties’ candidates. One may argue that individuals matter more than their socio-demographic profile. They would be right. The data however reveals that AAP is yet to open its door to more women and minority candidates if it wants to hold true to its claim of being representative and inclusive.
* Infographics: Kaustubh Khare
We welcome your comments at
letters@scroll.in.
In terms of education level, AAP candidates were marginally more educated than its opponents (44 graduates and more, compared to 41 for the BJP and 35 for Congress). The share of highly educated candidates among AAP is also higher in 2015, compared to 2013.
Despite its image of being a “tech party” and Arvind Kejriwal’s own background as an IIT engineer, the qualifications of AAP candidates tell their own story: there are only five engineers, 23 hold a social science or arts degree (B.A.(pass) being the most common degree), seven a law degree, four a business degree and only three have a science degree (including one medical doctor). The 26 remaining candidates are below graduate level.
As a contrast, the BJP’s candidates were predominantly either below graduate level (28) or social science and arts graduates (26). The party list contains more lawyers (11) and less graduate professionals (one engineer, one business studies and two science graduates). One BJP candidate, a 47 year-old multi-millionaire, still awaits the results of his B.A. final year (pending 2015).
The youngest ever?
AAP candidates were significantly younger than their opponents. With an average age of 44, the new Delhi Assembly is probably one of the youngest, if not the youngest, in India ever. The 2015 AAP candidates were comparatively younger than the 2013 lot. The BJP and Congress are on a similar and stable distribution in both elections.
In 2015, 42 out of 70 candidates from AAP are below the age of 45, more than twice the numbers of BJP and Congress.
Rich like them
Perhaps the more surprising figure is the fact that the AAP candidates situated in the Rs 1 crore-Rs 10 crores assets are in 2015 in equal number with the Congress, and marginally more numerous than the BJP candidates in the same bracket. However, there were significantly more AAP candidates in the lower segment (below Rs 30 lakhs of assets) and significantly less AAP candidates in the higher segments (Rs 10 crore and above). The asset distribution roughly reflects the distribution of education levels across candidates.
What about Aam Aurats?
Can the Aam Admi Party also claim to be an Aam Aurat Party? Not really. The distribution of women candidates and MLAs is strikingly similar across parties.
Past election results reveal that this trend is also quite stable. What is also striking is that the overall number of candidates is decreasing over the years, contrary to opposite trends observed in most other states.
In that regard, Delhi is not at all showing the way, the representation of women having at least marginally risen in most recent Assembly elections, including in Haryana.
Muslims’ representation
One can assume that AAP succeeded in capturing the essential part of the Muslim vote, one of the Congress’ last bastions in Delhi in the previous election. That swing did not take place on the basis of ticket distribution to Muslim candidates (five from AAP and Congress and one for the BJP). The number of elected Muslim representatives remains stable (four) and in fact, the overall number of Muslim candidates has significantly decreased since a peak in 2008.
What does this say about AAP? Obviously, one assembly never resembles another, even if the profile distribution of MLAs is similar. There are many reasons to think that AAP MLAs differ from the “traditional” Delhi politicians.
The defining character of this new assembly – and of the party that almost entirely occupies it – is its young age. In that sense, the AAP victory also has an important generational dimension, contradicting the notion that the BJP is young India’s preferred choice. The data does not say whether young voters voted more for AAP than the BJP. Only survey data will show that. But it is safe to assume that young voters are likely to be more attracted by a party showing a younger face than by the sometimes-geriatric candidates of traditional parties.
As for the rest, on basic indicators, AAP candidates don’t differ much from other parties’ candidates. One may argue that individuals matter more than their socio-demographic profile. They would be right. The data however reveals that AAP is yet to open its door to more women and minority candidates if it wants to hold true to its claim of being representative and inclusive.
* Infographics: Kaustubh Khare