


From November to February, more than nine million names were deleted from the Bengal electoral rolls in the space as part of what the Election Commission of India calls a Special Intensive Revision.
This was followed by a shock landslide win by the Bharatiya Janata Party on May 4, where the Hindutva party won 70% of the seats in the Assembly.
In this piece, we use statistical methods to examine whether SIR deletions were associated with electoral outcomes. We also build a simple model to try and quantify the extent of the impact.
Our analysis shows a strong relationship between SIR deletions and electoral performance in Bengal: constituencies where the electoral roll shrank more also saw the BJP do better relative to its main challenger, the Trinamool Congress. Notably, a comparable exercise in Bihar, which also underwent an SIR, shows no equivalent pro-ruling alliance pattern linked to roll shrinkage.
Our method
We seek to find the relationship between voters deleted during the SIR and the relative performance of the BJP and Trinamool: the two main players in this election.
This approach differs from much of the existing discussion, which compares the number of deleted voters with the final winning margin. In our view, that arithmetic misses how rolls actually shape elections. Roll deletion does not merely subtract names from a list. It can change the composition of the electorate that remains, the balance of local coalitions and the signals voters and parties read about who is strong.
The better test, then, is whether roll shrinkage was systematically associated with changes in party margins.
To do this, we must understand the relationship between roll shrinkage and the relative electoral performance of the BJP vis a vis the Trinamool, using Assembly constituency level data.
In West Bengal, “all-cause” roll shrinkage is measured as the percentage fall in total electors from the 2024 Lok Sabha divided by assembly segments to the final post-SIR roll before the 2026 Assembly election. For example, in Kolkata’s Bhabanipur assembly constituency, the number of electors shrank from 2,05,553 in the 2024 general election to 1,60,313 in the final post-SIR roll before the 2026 election – a roll shrinkage of 22%.
“All-cause” means the total fall in registered electors, whatever reason was recorded for deletion. It includes valid removals like deaths, migration, duplicates but can also include erroneous removals of eligible citizens. It is, therefore, simply a measure of how much the formal electorate contracted over the administrative exercise.
What we are tracking is the relative change in the electoral performance of the BJP vis-a-vis the Trinamool from 2021 to 2026. We measure this as the change in the BJP minus Trinamool vote share from 2021 to 2026. If it becomes less negative or more positive, the constituency has shifted toward the BJP relative to the TMC.
For example, in Bhabanipur, the BJP received 35.2% of the vote in 2021 and the Trinamool received 57.7%, giving the BJP a margin of −22.5 percentage points. In 2026, the BJP received 53.0% and the Trinamool received 42.2%, a margin of +10.8 points. The constituency thus moved 33.3 percentage points toward the BJP relative to the Trinamool.
We replicate the same logic for Bihar, another state where parties raised concerns about the SIR process. There, all-cause roll shrinkage compares the 2024 Lok Sabha elector count divided by assembly segments with the 2025 Assembly elector count. The electoral outcome is the change in the BJP-led National Democratic Alliance minus the opposition Mahagathbandhan margin between the 2020 and 2025 Assembly elections.
Because Bihar’s alliances changed over this period, we rebuilt National Democratic Alliance and Mahagathbandhan vote shares from party-level results separately for each year, using year-specific alliance membership.
The data cannot establish intent behind deletions, nor show how deleted voters would have voted, but they can tell us whether the geography of roll shrinkage lined up with the geography of electoral change.
What the data shows
The first difference between Bengal and Bihar is the scale of deletions (see Figure 1).
In West Bengal, the median constituency saw roll shrinkage of 9.6% – which means half the constituencies had lower shrinkage and half had higher shrinkage.
Bihar’s median, on the other hand, was only 3.0%. Positive values mean the electoral roll got smaller. This does not prove that any particular deletion was improper. It just shows that Bengal’s contraction was much larger – all the more stark given that the West Bengal election was a year later, and the rolls should have gained an extra year of newly registered voters.

To estimate the relationship between all-cause roll shrinkage and electoral outcomes, we use a vote-weighted linear regression – constituencies with more voters count more in estimating the line, since a margin shift there involves more people. In practice, the weighting makes little difference.
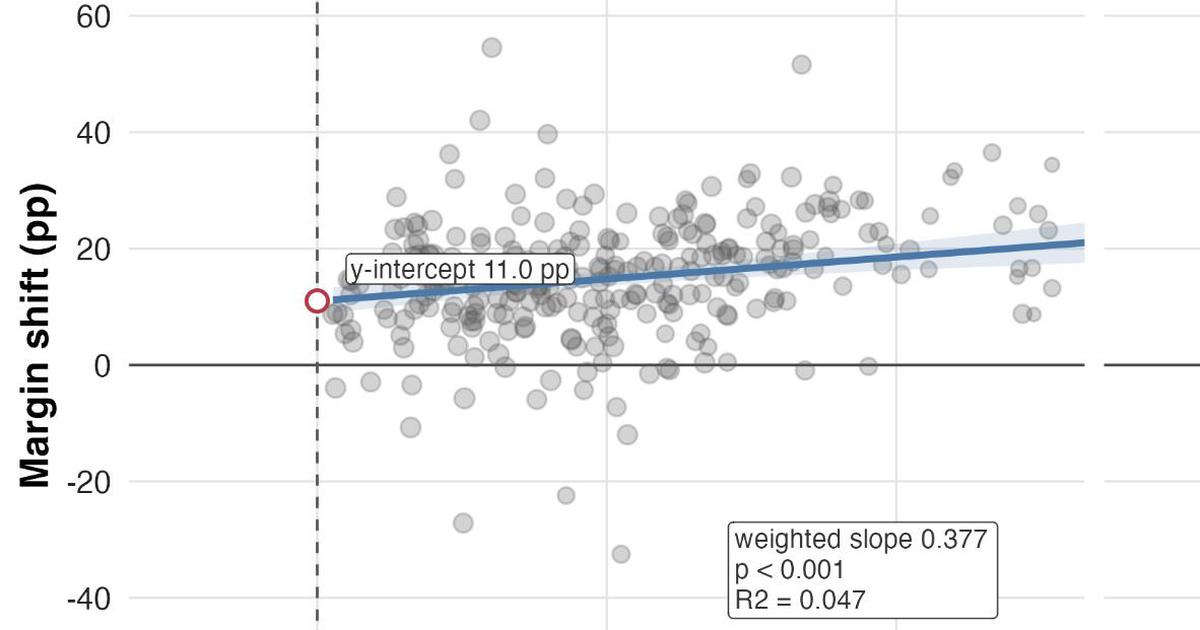
In West Bengal, there is a noticeable relationship between SIR’s roll shrinkage and electoral outcomes: each percentage point of roll shrinkage is associated with a 0.377 percentage-point shift in the BJP-Trinamool margin toward the BJP (see Figure 2). A constituency moving from 0 to ten percent roll shrinkage would thus be associated with roughly a 3.8 point movement toward the BJP and away from the Trinamool.
In contrast, Bihar shows no equivalent pro-National Development Alliance pattern – the weighted slope is in fact negative.
The West Bengal relationship is statistically strong. Bihar’s relationship is weaker and not statistically significant (the p-value is typically expected to be less than 0.05 for statistical significance). The Bihar comparison matters because it rules out one easy explanation. If roll shrinkage mechanically produced a pro-ruling-party swing wherever it occurred, Bihar should show the same pattern. It does not. The Bengal result remains an association rather than proof of causality but the Bihar comparison makes it harder to dismiss the pattern as a statistical accident.

We then break down the deletion data because all-cause shrinkage is deliberately broad. Table 1 asks whether the association appears only in that broad measure, or also when we use the official deletion categories.
Non-death deletions are removals not recorded as deaths. The distinction matters because death deletion is routine roll correction, while non-death deletion is where questions of residence, shifting, duplication, documentation or error are more likely to arise. The data also contains an ASDD-labelled category – voters marked “absent, shifted, dead or duplicate”. Because deaths are reported separately, we treat ASDD as an official category, not as proof of why any one voter was removed. Finally, supplementary-list deletions are those made right at the end, including through the controversial "logical discrepancy" protocol. To make these measures comparable across constituencies, each count is divided by the constituency's 2024 elector total.
The narrower measures point in the same direction as the broad one. Non-death deletions, ASDD deletions and supplementary-list deletions are all positively associated with a BJP-favourable margin shift.
This does not identify wrongful deletions. It shows the Bengal pattern is not driven by one broad variable – it persists when the deletion file is broken into narrower categories.
| Deletion measure | Median rate | Weighted margin slope | p-value |
|---|---|---|---|
| All-cause roll shrinkage | 9.6% | 0.378 pp | < 0.001 |
| Non-death deletions | 7.6% | 0.410 pp | < 0.001 |
| ASDD deletions | 6.1% | 0.386 pp | 0.004 |
| Supplementary deletions | 2.7% | 0.407 pp | 0.021 |
Measuring the scale of impact
How consequential are these shifts for seats? Any conversion from vote share to seat share is necessarily speculative: it is a model, not reality. But the exercise helps us clarify the scale of the association we find.
For this exercise we make use of a uniform swing model. The model calculates the average shift in vote margins or swing between two elections and applies that shift uniformly across all assembly constituencies. For instance, if a model finds a 10 percentage point shift in margin towards the BJP, then we assume each Assembly constituency experienced that same 10 point shift from 2021 to 2026. Of course, swings are not uniform in the real world, but the model is widely used because it does not build in any partisan advantage in translating vote swings into seat outcomes.
We find across constituencies, weighted by valid votes, the BJP-Trinamool margin moved 14.8 percentage points toward the BJP between 2021 and 2026. The regression line estimates that in a constituency with no roll shrinkage (the intercept of the line in the left panel of figure 2), the BJP-Trinamool margin would still have moved 11.0 points towards the BJP. In other words, the model associated roughly 3.8 points of the observed margin swing with roll shrinkage. Applying the 11.0 point no shrinkage swing to 2021 constituency margins, the BJP would still be expected to win about 163 seats, above the 148 seat majority mark. When we simulate the swing under no shrinkage using the regression output and uncertainties, the BJP would be expected to form the government 89% of the time.
This is a deliberately narrow counterfactual. It removes only the constituency level association between roll shrinkage and margin shift. It does not capture broader political effects: whether the SIR changed campaign attention, voter expectations, perceptions of party strength, or the broader political environment.
For instance, if voters in Bhabanipur saw that the BJP had become more competitive in surrounding areas due to the SIR, then they too could believe that the BJP had a better chance of winning this time and switch their vote from Trinamool to BJP. This would yield an equilibrium swing away from the TMC to the BJP across the constituencies of South Kolkata. If the process made the BJP appear stronger statewide, for instance, that effect would not be measured by the constituency-level regression and could only be accounted for in an equilibrium or statewide effect.
Figure 3 therefore asks: under a no-roll-shrinkage scenario, how much additional statewide movement back toward the Trinamool would be needed to make the result uncertain? In this model, just a 2 percentage-point statewide shift back toward the Trinamool would be enough to bring down the probability of the BJP getting a majority in the Assembly below 50%.
We are not claiming this counterfactual happened. The statewide, or "equilibrium", effects of the SIR are impossible to quantify. What the exercise shows is that the margin shifts associated with roll shrinkage were large enough to matter for seats, and that under some plausible scenarios the outcome itself would have been in doubt. Readers can judge the plausibility of those scenarios for themselves.

What this means
The first implication of this analysis is that margins should not be interpreted mechanically, as though the only question were whether the number of deleted voters exceeded the final winning margin.
Changes to the rolls operate on an election before a single vote is counted: they alter the composition of the electorate, shift the local balance of party strength, and shape how parties and voters read the contest and respond to it. It is for this reason that our analysis asks whether roll shrinkage was associated with changes in party margins rather than merely whether deletions outnumbered the margins that resulted, and it is arguably why our estimates of the electoral consequences of roll shrinkage run larger than those produced by more mechanical comparisons.
None of this evidence proves fraud, establishes that the SIR caused the BJP's victory, or shows that the deleted voters would have voted for the Trinamool. What it establishes is narrower but, we would argue, harder to set aside: that the constituencies where the roll contracted more also tended to move further toward the BJP relative to the Trinamool, and that a comparable exercise in Bihar yields no equivalent pro-ruling-alliance pattern that might explain the Bengal result away as a generic artefact.
That Bengal's roll contraction was unusually large by any comparative standard, makes this result even starker.
This is why the question raised by the SIR is institutional as much as it is electoral. Electoral rolls in any large democracy must be cleaned, because large democracies accumulate deaths, duplicates, migration and error, and a roll that is never revised eventually misrepresents the electorate it is meant to record. But the opposite error is equally real: an eligible citizen can be struck from the list and thereby lose the practical ability to vote, and when such removals cluster geographically in ways that track electoral change, the cost is borne not only by individuals but by the credibility of the contest itself. In a democracy, the election body's task is to administer the competition, not to alter the field on which it is fought.
Bhanu Joshi is an incoming Assistant Professor in the Department of Politics and Social Change at Australian National University and co-founder of DALES (PhD, Political Science, Brown University). Neelanjan Sircar is an Associate Professor in the Division of Social Sciences at Ahmedabad University.
Data Sources: For West Bengal, election results and elector roll totals come from public Election Commission of India and West Bengal Chief Electoral Officer sources. The deletion category table later in this section uses an assembly-wise deletion file provided by the Sabar Institute from documents published by the Election Commission during the SIR process. For Bihar, election results and elector counts come from Election Commission sources. We group party-level votes into the BJP-led National Democratic Alliance and the Rashtriya Janata Dal-led Mahagathbandhan according to which parties belonged to each alliance in each election year, because several parties changed sides or contested separately between 2020 and 2025. The West Bengal analysis excludes one constituency, Falta, where a repoll produced an anomalous contest, leaving 293 constituencies. All data and code are available in our replication package.