


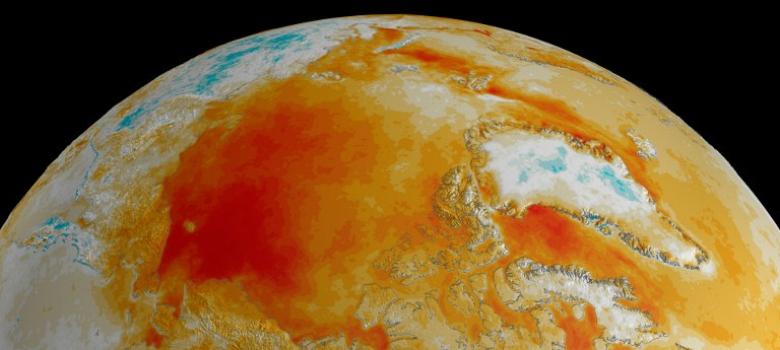
It's hot out. Everywhere. Even at the poles of the earth. We already know that 2014 was the warmest year on record and also that sea surface temperatures reached a record high. This has meant storms, droughts, raised sea levels and heat waves and other extreme weather events that have been caused by global warming. Among the most dramatic is the fall in sea ice in the Arctic.
Last year's State of the Climate report by the US' National Oceanic and Atmospheric Administration said that the Arctic had experienced its fourth-warmest year on record and among its lowest minimum sea ice extents. The numbers themselves are easiest to see when charted out.
But there is an even simpler way to understand just how much of the Arctic ice has disappeared over just the last few years, thanks in part to global warming. US President Barack Obama made reference to it earlier this month, when he unveiled his biggest plan to tackle climate change yet. "Shrinking ice caps forced National Geographic to make the biggest change in its atlas since the Soviet Union broke apart," Obama said in his speech.
The makers of the magazine and the atlases indeed confirmed Obama's words, and then put out this handy GIF, combining National Geographic Atlases from 1999 through 2014 to show just how Arctic Ice has melted over that time.
The results are clear to ice. To the untrained eye, it looks as if almost half of Arctic sea ice has disappeared over just 15 years. In a post on its website, National Geographic admitted that the maps weren't entirely accurate, but nevertheless offered the best possible way to show a dynamic environment in a static format. And indeed, no one is making the claim that Arctic ice isn't disappearing.
The US' National Snow & Ice Data Centre finds that this year's ice is "well below average for this time of the year". The centre also says that, although the numbers are higher than 2012's, one of the worst year on records, satellite imagery suggests the "ice has become rather diffuse (low ice concentrations) with many large broken ice floes surrounded by open water." How soon before the race to the north pole becomes less about sledding and more about swimming?
We welcome your comments at
letters@scroll.in.
Last year's State of the Climate report by the US' National Oceanic and Atmospheric Administration said that the Arctic had experienced its fourth-warmest year on record and among its lowest minimum sea ice extents. The numbers themselves are easiest to see when charted out.

Marclimate Graphs
But there is an even simpler way to understand just how much of the Arctic ice has disappeared over just the last few years, thanks in part to global warming. US President Barack Obama made reference to it earlier this month, when he unveiled his biggest plan to tackle climate change yet. "Shrinking ice caps forced National Geographic to make the biggest change in its atlas since the Soviet Union broke apart," Obama said in his speech.
The makers of the magazine and the atlases indeed confirmed Obama's words, and then put out this handy GIF, combining National Geographic Atlases from 1999 through 2014 to show just how Arctic Ice has melted over that time.
The results are clear to ice. To the untrained eye, it looks as if almost half of Arctic sea ice has disappeared over just 15 years. In a post on its website, National Geographic admitted that the maps weren't entirely accurate, but nevertheless offered the best possible way to show a dynamic environment in a static format. And indeed, no one is making the claim that Arctic ice isn't disappearing.
The US' National Snow & Ice Data Centre finds that this year's ice is "well below average for this time of the year". The centre also says that, although the numbers are higher than 2012's, one of the worst year on records, satellite imagery suggests the "ice has become rather diffuse (low ice concentrations) with many large broken ice floes surrounded by open water." How soon before the race to the north pole becomes less about sledding and more about swimming?